Value Driver Trees (Deconstructing Value).
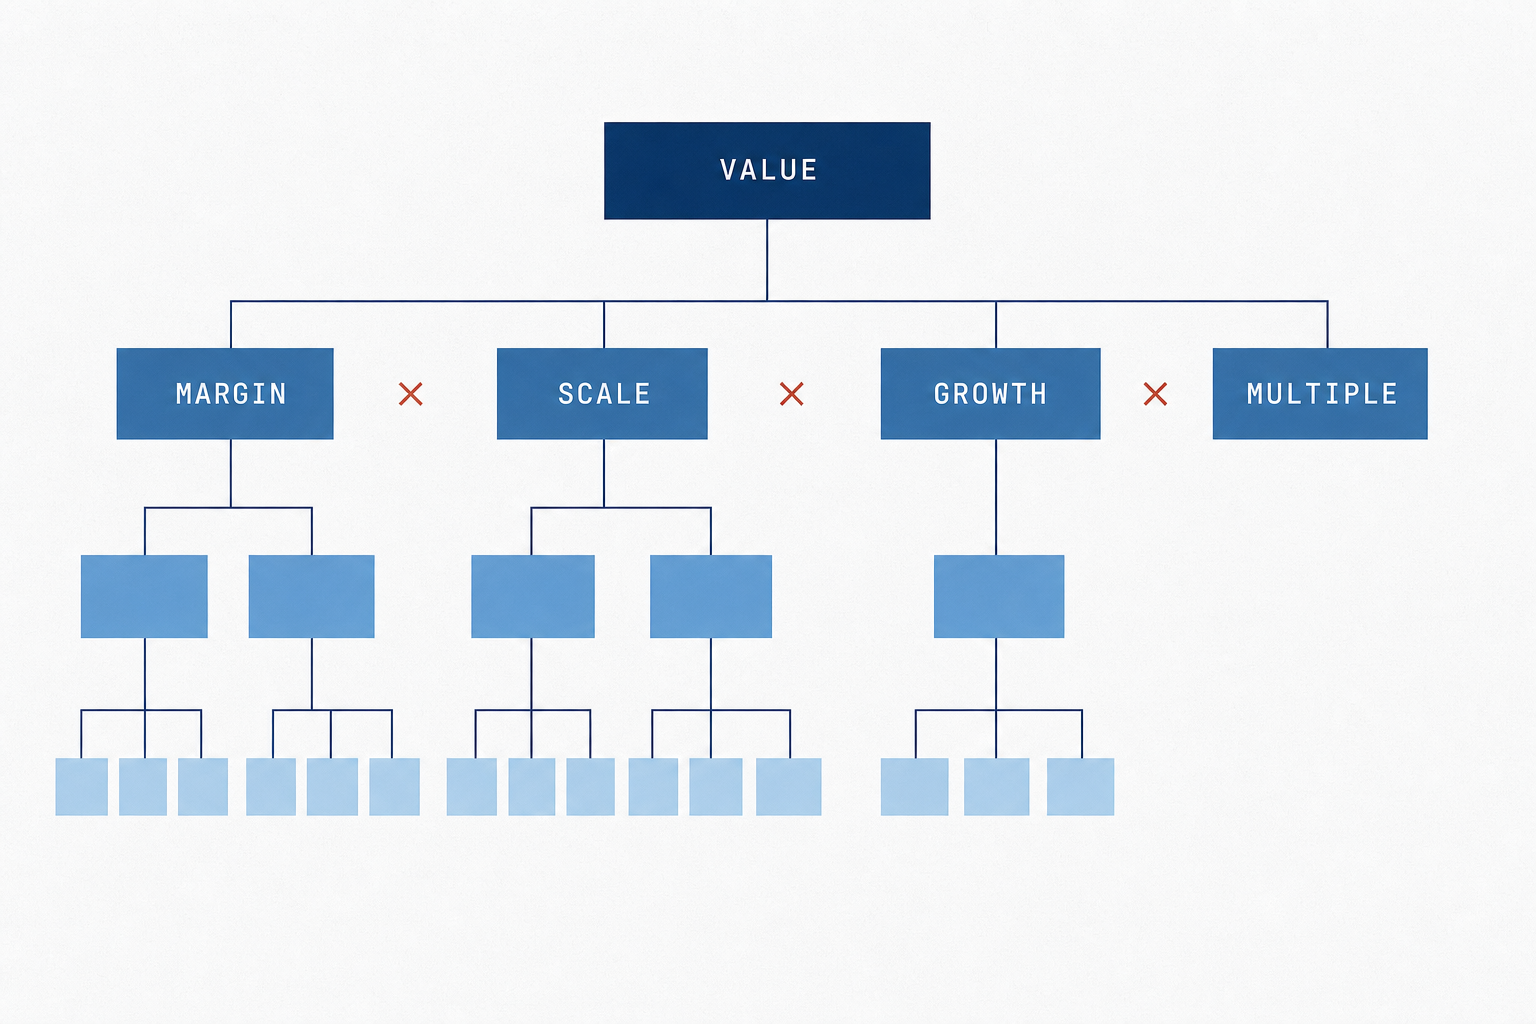
Enterprise value is not a number. It is a product of a handful of numbers, most of which you do not control and a few of which you do, and the whole job of underwriting a business is telling those two groups apart.
Value Driver Trees (Deconstructing Value)
Enterprise value is not a number. It is a product of a handful of numbers, most of which you do not control and a few of which you do, and the whole job of underwriting a business is telling those two groups apart.
This framework is McKinsey's, not mine. The value driver tree comes out of Valuation: Measuring and Managing the Value of Companies by Koller, Goedhart and Wessels (4th edition, Wiley, 2005), the edition I learned it from and still work off. There are newer ones, a 7th in 2020 and an 8th in 2025, with fresh cases and more on digital and ESG. The core mechanics have not moved.
What I have added is a way of running it. I drive the tree through the order Jeremy Howard sets out in Designing Great Data Products: objective, then levers, then data, then models. That order turns a one-off diligence exhibit into a repeatable process, and it is how I have used it to find and move value in real businesses rather than just describe them.
Every business gets valued twice. Once by a market, which hands back a figure and no explanation, and once by whoever is deciding whether to buy it, run it, lend to it or work in it. That second valuation is useless unless it can be taken apart. A single number cannot be argued with. A product of eight numbers can be argued with eight separate times, which is the only kind of argument that improves a decision.
The one-line version
Take any business and write its value as a product:
Value = (unit profitability) × (operating scale) × (growth) × (exogenous factors)
Four levers. The first two are almost entirely inside management's control. The third is partly. The fourth is not controllable at all, and pretending otherwise is where most valuation arguments go wrong.
That split is old. In 1912 Donaldson Brown, an explosives salesman at DuPont, wrote a memo decomposing return on investment into profit margin times asset turnover. Pierre du Pont hired him into financial control on the strength of it, and the DuPont decomposition is still the first thing taught to anyone explaining why two companies with the same return on equity are not the same business. Brown's insight was not the arithmetic. It was that a single ratio hides which of two entirely different management problems you have.
Everything since is the same move applied further down. Rappaport's Creating Shareholder Value (1986) named seven value drivers. McKinsey pushed it into ROIC and growth as the two composite drivers deciding whether growth creates or destroys value at all. Siemens has run value-driver-tree management since 1998. Yet the practice has only just started acquiring a formal grammar: Matthies' 2025 Value Driver Modelling Notation proposes 34 semantic constructs, because "despite their increasing application, there are still no systematic guidelines for the modelling of such conceptual models." A hundred and thirteen years of redrawing the same chart because it keeps working, and still no agreed way to draw it. Which is why the trees below all look slightly different.
Going deeper, five levels down
Textbook exhibits stop at three or four levels. That is a publishing constraint, not an analytical one. In a real assessment the tree keeps going until it hits something you can measure in the target's own operating data or benchmark against somebody else's, and for a multi-site services business that is usually five levels down.
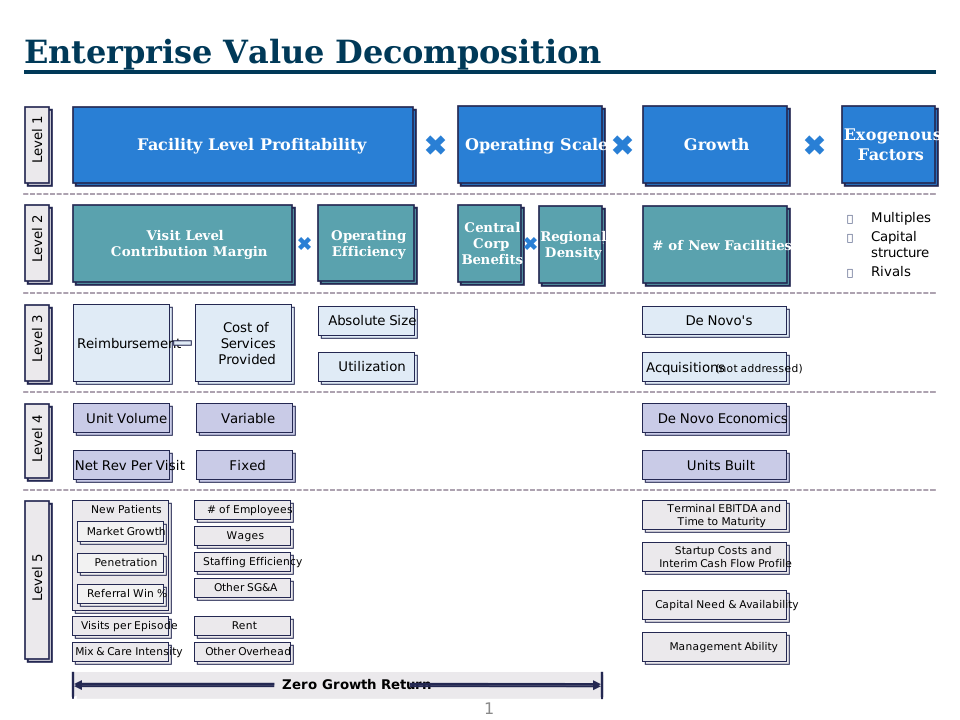
The exhibit at the top of this post is one I built for a healthcare services target, a multi-site provider where the whole investment question was whether facility-level economics survived contact with more facilities. Three things in it are worth more than the rest.
The left spine is where the money is. Facility-level profitability opens into visit-level contribution margin, then reimbursement and cost of services, then unit volume and net revenue per visit, and finally payer mix, referral mix and case-mix intensity. Five levels from enterprise value to payer mix. That distance is the point: every level down converts an opinion into an observable. "Margins are good" is an opinion. "Commercial payers are 41% of visits and the commercial rate is 2.3 times Medicaid" is a fact somebody already knows, and can be checked.
The Zero Growth Return bracket is the honesty check. It spans the operating levers and excludes growth, answering one question: what does this business return if it never opens another location? At entry that is the only question that matters, because the growth story is the part of the thesis with no evidence yet and the part the seller has already priced. If the zero-growth return does not clear your hurdle on its own, you are underwriting a construction programme, usually at the wrong multiple.
Acquisitions is bracketed and marked "not addressed." Not laziness, the most important annotation on the page. A tree showing every branch fully specified implies you have a view on every branch. I did not have one on inorganic growth here, so it is drawn and left open. A reviewer can challenge the gap directly instead of finding it three weeks later in a footnote. Naming what you did not analyse is the cheapest credibility you will ever buy.
The rule that makes a tree hold
Most driver trees in the wild are not trees. They are mind maps with a currency symbol at the root: boxes joined by lines meaning "relates to" rather than "multiplies by." They feel rigorous and cannot be used, because no arithmetic is implied by the edge, so no branch can be varied while holding the others still. One rule fixes it, and it is worth more than the rest of the method combined:
Every edge is an arithmetic operator, a multiplication or a division or a difference. Every Level-1 lever is independent of the others.
If you cannot say which operator an edge is, the edge is a hunch and does not belong on the page. If moving one Level-1 lever forces another to move, they are the same lever drawn twice.
Independence makes the tree usable in a room with other people. It gives you reviewer discipline: whoever challenges volume must be answered with volume evidence. Everyone who has sat through a diligence session knows the move, a hard question about one lever answered with a confident story about another. The tree is the cheapest defence, because the deflection becomes visible. You can point at the branch nobody answered.
Multiplicativity does the other half. In a product a 10% miss anywhere is a 10% miss overall, so every leaf is comparable on the same scale and you can rank diligence by the width of each leaf's plausible range. It also means errors compound rather than cancel: five leaves each 10% optimistic is a 61% optimistic answer. That is the most common way a well-built model produces a badly wrong number, and only a multiplicative tree makes it visible.
Levers, not predictions
Back to Jeremy Howard, because this is the part that changed how I build these.
In 2012 Howard, Margit Zwemer and Mike Loukides published Designing Great Data Products, the essay that introduced the Drivetrain Approach. Their complaint was that data teams built ever-better predictions of outcomes nobody could act on. Their fix was an order of operations, and the order is the whole argument: define the objective, then specify the levers, "what inputs of the system we can control, the levers we can pull to influence the final outcome," then work out what data you need, and only then build the models. In their words: "We are entering the era of data as drivetrain, where we use data not just to generate more data (in the form of predictions), but use data to produce actionable outcomes."
A value driver tree is step two, drawn as arithmetic. The objective is enterprise value. The tree is the lever specification. The model comes last and contains exactly the leaves the tree named. Build it in that order and every line in the model has a reason. Build it the other way, model first and drivers reverse-engineered afterwards, and you get a beautiful workbook whose sensitivity tab flexes revenue growth by 2% because that is what the template did.
The essay is in my best-books list for 2023 for exactly this reason: a short piece about insurance pricing that turns out to be about underwriting. Pairing it with McKinsey's tree is the whole method. McKinsey supplies the anatomy, Howard supplies the order you assemble it in.
Amazon runs the same distinction. Working Backwards splits controllable input metrics from output metrics: inputs are what you move directly, outputs are revenue and share price and NPS. The case for obsessing over inputs is the case for building a tree down to the leaves: when you are looking at a controllable input metric, you know exactly what you need to improve. Enterprise value is an output metric. The leaves are input metrics. If the tree does not terminate in something an operator could change on Monday, it has not gone far enough.
Five businesses, five shapes
The skeleton is stable. What changes is where the depth is, which lever binds, and where the skeleton stops fitting. Five trees follow. Each breaks the framework somewhere different, and the breaks are the useful part.
Tutoring: the labour-heavy multi-site
Many small units, labour that scales with volume, fixed cost per site that does not, expansion layered on top. The closest analogue to the healthcare target.
Exhibit 2 · Multi-site tutoring
EV = (rate × utilisation × W2/1099 mix, net of site fixed cost) × (corporate absorption × regional density) × (new sites × ramp × online) × (multiple)
Each Level-1 lever is independent. A reviewer who challenges margin should not end up arguing about growth.
- W2/1099 mix sits four levels down and is not a cost driver. It is a legal classification that sets cost structure, margin volatility and, because misclassification reprices deals, the buyer's risk premium. Invisible at Level 2 inside "contribution margin." A one-sentence question at Level 4.
- Site utilisation is the widest leaf. Sessions over capacity. High sensitivity plus wide uncertainty is the ranking rule for diligence effort, so it is where the first week goes.
- Growth moves the multiple, not just revenue. A physical-site chain and a chain with a real online platform are different comparables sets. That is why growth sits on the multiplicative row rather than buried inside margin.
An AI company
The hardest tree here to draw honestly, because most of the levers are still hypotheses. That is exactly why it is worth drawing. The tree becomes a list of what has to become true, in order, with the binding branch marked.
Exhibit 3 · AI company
EV = (conversations × qualify × close × contract value × retention) × (margin net of cost to serve and delivery hours, lifted by reuse) × (recurring mix × moat × trust)
Volume is the binding branch. A margin argument is not an answer to a volume challenge.
- Volume is the binding branch and nothing else is. Logos decompose into conversations per week times qualify rate times close rate. The least glamorous arithmetic in the company and the only arithmetic that matters early. Every other branch argues about what happens after the volume exists.
- The margin engine decides whether it is software or services. Delivery hours per install, opened into intervention intensity and runbook coverage, settles it. Common-core reuse asks the same question from the other side. If both move, deliveries stop consuming the founder. If not, it is a consultancy with good tooling, at a much lower multiple.
- The multiple engine is honest about being slow. Recurring mix, moat and trust surface do not respond to effort this quarter. You protect that branch rather than push it.
- The tree's real job here is self-discipline. The margin engine is engineering and the volume branch is phone calls, so the margin engine is always more fun. Working a non-binding branch is not progress, it is procrastination with a commit history.
A forging shop: where the tree needs a cash cycle
Ashgrove Forge and Machine makes precision aerospace forgings, titanium and nickel structural parts for engine and airframe programmes. The ordinary industrial case: capital-intensive and working-capital-intensive at once, which is the combination the four-lever tree handles worst.
- Inventory about 150 days. Raw bar, work in process and finished goods carried simultaneously.
- Receivables about 95 days. OEM customers pay on their terms.
- Payables about 40 days. A concentrated alloy supply base expecting fast payment, so no supplier float offsets the other two.
- A 205 day cash conversion cycle. Nearly seven months from cash out to cash back, against an Industrials-sector mean nearer 87 days, consistent with inventory-heavy sectors showing much longer cycles.
Exhibit 4 · Precision aerospace forgings
EV = (price × yield, net of alloy and conversion) × (press utilisation × capex discipline) × (1 ÷ cash cycle) × (multiple)
Inventory 150 plus receivable 95, net of payable 40, gives a 205 day cycle. Every extra dollar of revenue costs cash months before it pays.
- Growth is a cash outflow for two to three years. Qualification capital and tooling are funded well ahead of the first shipset, then working capital scales with the volume you just won.
- Every other tree here is a same-period identity. This one is not. Drawn without the cash branch, the tree scores a forge that stops winning work as the healthy one: better margins, better cash flow, better return on capital, all true, all describing a business liquidating its own future.
- Two honest fixes. Draw two trees, current shipments and programme investment, never combined into one number. Or promote the cycle to a Level-1 lever, as above, so a reviewer challenging "growth" has to say whether they mean this year's shipments or this year's commitments. I prefer the second.
- A negative cash conversion cycle is the opposite of this. That is the Dell and Amazon case, where the customer pays before the supplier and growth funds itself. Both get called "the cash cycle is against us." Only one lets you grow for free.
- The lesson generalises. Any business where investment and return sit in different periods, a pharma pipeline or a franchise programme or a mine or a land bank, needs the clock drawn on the tree.
An accounting firm: where the tree is an org chart
Professional services is where the tree stops being a valuation exhibit and starts describing who does what.
Exhibit 5 · Professional services
EV = (rate × realisation, net of delivery cost) × (staff per partner × utilisation) × (logos × wallet share) × (multiple)
Leverage is the lever most firms will not pull, because pulling it changes who does the work.
- Realisation is three leaves deep because that is where fees leak. Realisation runs 85% to 90% across the industry, low to mid nineties at strong firms, and the gap is close to pure margin. Underneath sit scope discipline, WIP-to-bill lag and write-offs: three failures that look identical in the summary number.
- A firm that thinks it has a pricing problem usually has a scoping problem. The only way to tell is to open the branch.
- Leverage is the lever nobody pulls. Staff per equity partner is widely argued to be the most important practice-economics lever and it moves slowest, because pulling it means partners doing less of the work they are best at. Every leaf on that branch is a person's job description.
- Partners will want to discuss growth. It is the branch requiring nobody to change what they personally do all day. The tree puts the alternative on the same page at the same size, which is usually enough.
Vertical SaaS: where the tree exponentiates
The last one breaks the framework in the most interesting way. One lever is not multiplied, it is raised to a power.
Exhibit 6 · Vertical SaaS
EV = (ARPA × gross margin) × (gross retention × net expansion)^n × (new logos ÷ CAC payback) × (multiple)
This is the one lever on the page that is exponentiated, not multiplied. Retention is the only driver that compounds against itself.
- Net revenue retention is the compounding term. At 120% the business grows 20% a year having sold nothing. At 90% it re-sells a tenth of itself before it can grow a dollar. ChartMogul: above 100% NRR more than half of growth comes from the existing base, while low-retention companies get roughly 70% from new business. Same product, same market, different companies.
- Exponentiate it in the footer identity. Multiply it and the tree badly understates it beyond a year. This is the one place a strictly multiplicative tree is the wrong shape, and the page should say so.
- Net expansion deserves three leaves. Seat growth, module attach, price uplift. Three companies' worth of go-to-market work in one ratio.
- Inference cost is a new leaf on an old tree. The first cost line in a generation that scales with usage rather than headcount. For any product shipping model calls it belongs at Level 3, not inside "other COGS", because it is the leaf most likely to move by a factor rather than a percentage.
Three places the tree lies to you
A driver tree is a model of causation drawn as arithmetic, and both halves of that sentence are places it can go wrong. I have watched all three of these happen, twice to me.
1. It presents correlation as control. The edges say "multiplies by," which readers hear as "causes." Often the relationship runs the other way, or both leaves are downstream of something not on the page. A tree showing referral mix driving net revenue per visit is arithmetically true and causally silent about why referral mix is what it is, which might be one physician relationship about to retire. The defence is boring and effective: for each leaf you intend to act on, write one sentence saying what you would do to move it. If you cannot, it is an observable rather than a lever, and it should be shaded differently.
2. Naming a leaf turns it into a target. Goodhart's law, in Strathern's phrasing: when a measure becomes a target, it ceases to be a good measure. A tree handed to an operating team is a metric-selection exercise with unusual authority, and the leaves you draw become the leaves people optimise. Amazon's own account is instructive: expanding beyond books they picked "number of new detail pages created" as the selection input metric, on the reasonable theory that more pages meant more selection, and got a lot of pages. Before publishing a tree inside a company, read every leaf and ask the cheapest way to move that number. If it is not the way you meant, change the leaf or accept what you are about to incentivise.
3. It flatters the multiple. Exogenous is where most of the returns in a deal actually came from, and it is the branch with no leaves. The private-equity value bridge makes the point from the other side: exit equity decomposes into entry equity plus EBITDA growth plus multiple expansion plus debt paydown, and the attribution is routinely humbling. Kroll's Created Value Attribution framework exists because the conventional bridge lets managers claim organic credit for market-driven multiple movement. A forward-looking tree has the same defect in advance: everything left of the multiple is analysed to five levels and the multiple is typed in. Draw it at the same size, then write down what has to be true about the market for it to hold.
None of this makes the tree less useful. It makes it a tool with a grain.
Where this fits in my assessment process
I build the tree early, before the model, usually inside the first day or two of real information, because it is cheap and it determines what everything downstream must contain.
The sequence is the Drivetrain sequence. Objective first: what would make this a good decision, stated as a number. Levers second: the tree, built until every leaf is an operating datum somebody already tracks or a benchmark I can defend. Data third: the leaves are the information request, not a generic checklist but the fifteen or twenty series the arithmetic says will move the answer. Model last, containing those leaves and little else.
What changes when management sees it is the most useful part. People rarely argue with the numbers. They argue with the structure: "that is not how our margin works," "those two are the same thing for us," "you have missed the branch where all our money comes from." Each is worth more than a corrected figure, because it shows where their model differs from yours. A team that cannot draw its own tree has told you something no data room will.
Then the tree becomes the question list. Each leaf gets one of four marks: evidenced, benchmarked, asked, or not addressed, like Acquisitions in the exhibit above. Diligence is finished when nothing is left in the third state and everything in the fourth is there on purpose. That is a better completion test than "we have been at this six weeks," and it is why I draw the tree first. It is the only artefact in the process that can tell you when to stop.
How to make your own
Ninety minutes and a sheet of paper. The discipline is in steps three and four.
- Start with the four classical levers. Unit profitability, operating scale, growth, exogenous. Almost every operating business fits, because the split is really by who controls the lever: the first at the front line, the second by management, the third by the board, the fourth by nobody. Adapt the labels, "facility-level" or "part-level" or "engagement" or "cohort," but keep the four buckets. Renaming is cosmetic, merging is not. If the business genuinely needs a fifth, as the forge does with its cash cycle, add it at Level 1 rather than smuggling it into an existing branch.
- Decompose each lever multiplicatively. Every edge is times, divided by, or minus. Say the operator out loud as you draw it. If you cannot, you have drawn a theme rather than a driver. The test that catches this: could you vary this leaf by 10% and compute the effect on the root without touching anything else?
- Stop one level past the hand-wave. Descend until you hit the level where you catch yourself saying "well, that depends on the mix," then go one more. The hand-wave marks the edge of your understanding, and the leaf below it usually decides the answer. Stop when the next level would be a leaf nobody measures and no benchmark exists for. That is the real floor, usually four or five levels on the branch that matters and two on the branches that do not. Uneven depth is correct. A balanced tree means you decomposed by symmetry instead of by importance.
- Mark what you did not address. Draw the branch, box it, write "not addressed," move on. It stops a reviewer mistaking your silence for a view, and stops you quietly forgetting a branch because it was hard. The complete-looking tree is the dangerous one.
- Tie the leaves to data you can defend. Every leaf is one of three things: an operating figure the business already produces, an outside benchmark you can cite, or an explicit assumption with a named owner. Nothing else may be a leaf. A leaf that is none of the three is a placeholder, and placeholders at the bottom of a multiplicative tree are how a model produces a confident number with nothing underneath it. Write the source beside the leaf while you draw it. Afterwards you will not remember which ones you invented.
Then do the thing that makes it worth having built: hand it to somebody whose job is to disagree with you, and watch which branch they go for.
Sources and further reading
- The source of the framework. Tim Koller, Marc Goedhart and David Wessels, Valuation: Measuring and Managing the Value of Companies, 4th edition (Hoboken, NJ: John Wiley & Sons, 2005). This is the edition I work from. Later editions are current: the 7th (Wiley, 2020) and 8th (Wiley, 2025) both add cases and expand the digital and ESG material.
- Why growth only sometimes creates value. McKinsey, "Balancing ROIC and growth to build value."
- Which drivers actually move shareholder returns. McKinsey, "Which metrics really drive total returns to shareholders?"
- The origin. Donaldson Brown's 1912 DuPont memo (biography) and the modern three-factor form.
- The seven drivers. Alfred Rappaport, Creating Shareholder Value (1986): summary.
- Levers before models. Jeremy Howard, Margit Zwemer and Mike Loukides, Designing Great Data Products (O'Reilly Radar, 2012). In my 2023 best-books list.
- Input metrics versus output metrics. Colin Bryar and Bill Carr, Working Backwards; Amazon's controllable-input-metric practice and its Weekly Business Review mechanics.
- A formal grammar for driver trees. Benjamin Matthies, "VDMN: A Graphical Notation for Modelling Value Driver Trees" (arXiv:2512.14740, 2025), building on "Toward a notation for modeling value driver trees" (2024).
- Driver trees inside a large operating company. "Siemens' Value-Driver Tree in Digitalization."
- Where the returns came from. The value bridge, Kroll's Created Value Attribution, and CAIS on evolving drivers of PE value creation.
- When a leaf becomes a target. Goodhart's law and Strathern's formulation: overview and worked examples.
- Retention as a compounding lever. ChartMogul's SaaS Retention Report.
- Professional services. Realisation rate and the five levers of CPA firm practice economics.
- Cash cycles. CCC benchmarks by industry and the formula and levers that move it.
Related: The Anatomy of a Compounder decomposes seven companies' realised returns into the same independent drivers, after the fact rather than before. 02 Operating Model is where Lumen's leaves become a workbook. Growth Matters More Than Cost Savings argues which Level-1 lever to pull first.