Growth Matters More Than Cost Savings.
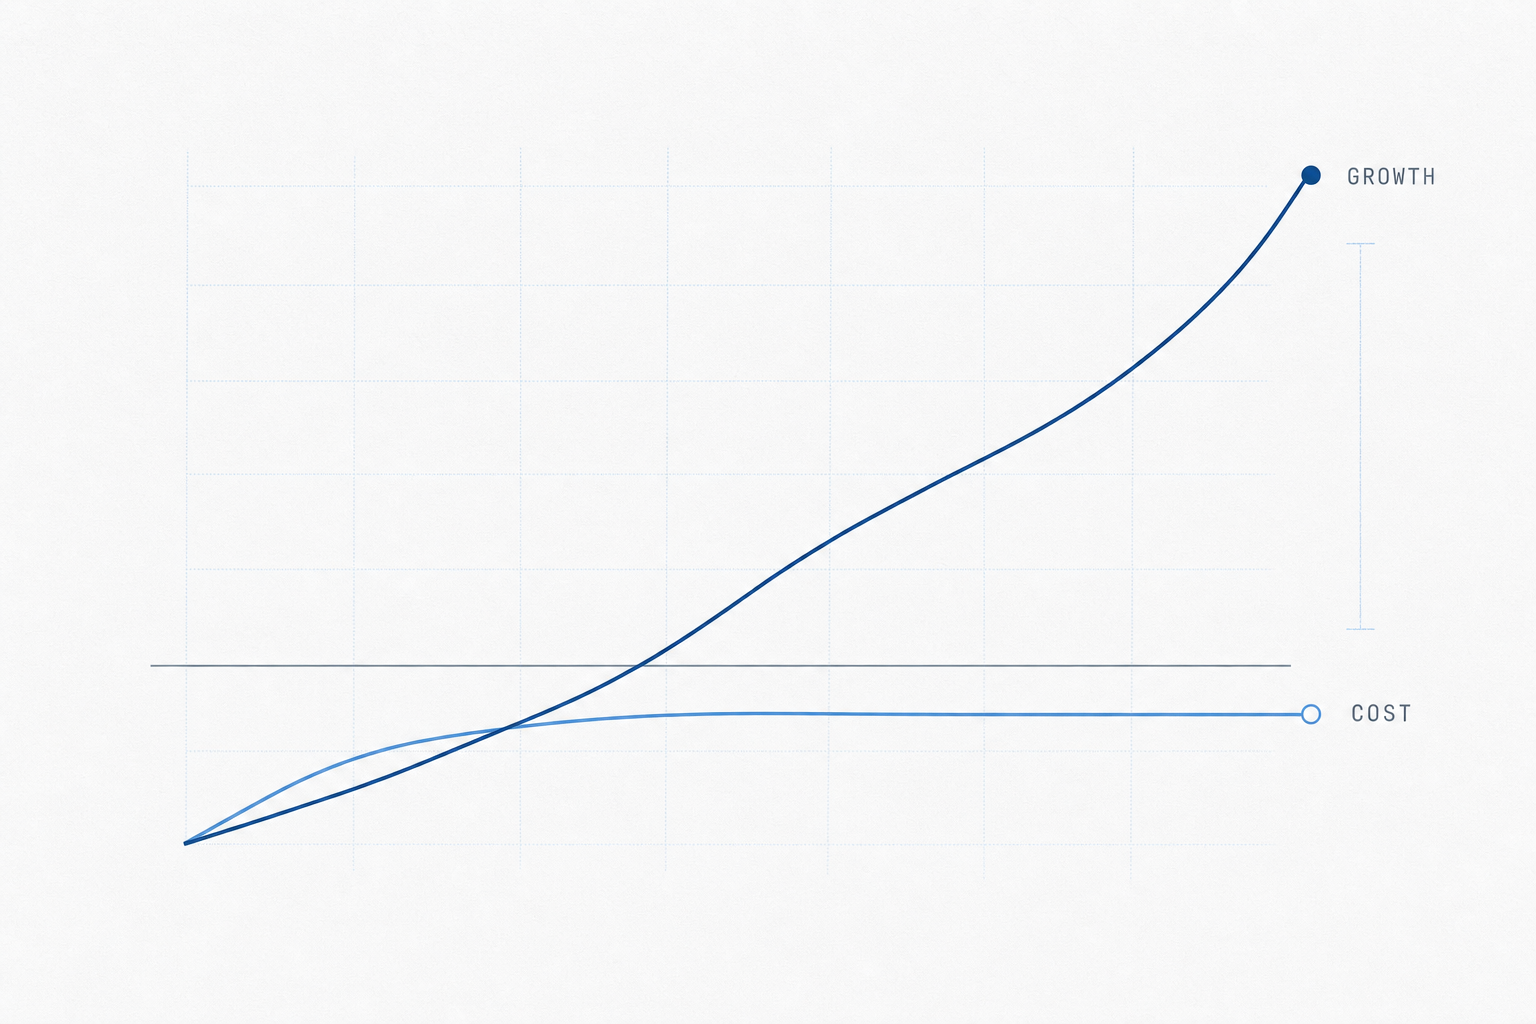
Cost savings are bounded and one-time. Revenue growth compounds and earns multiple expansion. Two charts — Credit Suisse's incremental growth curve and BCG's TSR decomposition — show why the long run weighs growth.
Growth Matters More Than Cost Savings
Companies talk about growth and cost as if they were two sides of the same lever — spend less, or earn more, pick whichever is tractable this quarter. The math says they are not the same thing. Over a long enough horizon, revenue growth is the only term in the value-creation equation that keeps compounding. Costs have a floor. Multiples mean-revert. Growth is what is left.
The incremental growth curve
There is a chart from Credit Suisse's Corporate Insights group, published years ago and rediscovered every few years, that does most of the work in this post. It plots the incremental EV/EBITDA multiple a company earns relative to its sector median against its incremental forward sales growth relative to that same sector median. The shape is an S-curve.
The first thing the curve says is that the market does not pay linearly for growth. The slope is shallow at the bottom, steep through the middle, and flattens at the top. A move from sector-median growth to moderately above the sector earns more multiple uplift than the same step once you are already growing aggressively. Growth gets rewarded most precisely at the threshold where the market starts to believe the company is genuinely compounding.
The second thing it says — in the green and red dots overlaid on the average line — is that the whole curve is conditional on the quality of the business. Top-quartile return-on-capital companies sit above the average curve at every level of growth. Bottom-quartile companies sit below it. The spread is small at sector-median growth and widens as growth accelerates. High-CFROI companies growing aggressively earn a multiple far above an average peer. Low-CFROI companies growing aggressively barely move. Growth multiplies whatever quality the business already has.
The implication for capital allocation is direct. If your returns on invested capital are good, accelerate growth — that is where the market re-prices you most. If your returns are weak, growth alone won't save you; the market knows the difference. Capital efficiency and growth are joint inputs, not substitutes. The companies that compound the most enterprise value over a decade hold both at once.
TSR is mostly growth
The Credit Suisse chart shows what the market is willing to pay. The next chart shows what shareholders actually receive. BCG decomposes the total shareholder return earned by top-quartile performers into four components — revenue growth, margin change, multiple change, and cash flow contribution — and tracks each across one-, three-, five-, and ten-year holding periods. It is one of the cleanest pieces of strategy data I know.
| Source of TSR | 1 year | 3 years | 5 years | 10 years |
|---|---|---|---|---|
| Revenue growth | 10 | 10 | 10 | 9 |
| Margin | 8 | 8 | 5 | 3 |
| Multiple | 10 | 2 | 2 | 2 |
| Cash flow | 3 | 2 | 2 | 2 |
| Total annualized TSR | 31 | 22 | 19 | 16 |
| Revenue growth share of TSR | 32% | 45% | 53% | 56% |
At one year, the four components are roughly balanced — revenue growth ten, margin eight, multiple change ten, cash flow three, total thirty-one percent. The largest single source is multiple change. A reasonable executive looking at one-year data could manage to the multiple — buy back stock, cut costs visibly, signal discipline, wait for the re-rating. That's one-year world.
Three years looks different. Multiple change has collapsed from ten points to two. Revenue growth, margin, and cash flow are roughly where they were. Total TSR is down from thirty-one to twenty-two. The year-one multiple expansion was mostly borrowed from years two and three. Once the market re-rates you, it doesn't keep re-rating you. The boost shows up once and mean-reverts.
At five years, margin halves. The market has had time to see that the cost program had a one-time effect. Total TSR drops to nineteen. Revenue growth still contributes ten.
At ten years, the picture is stark. Multiple change is two. Margin is three. Cash flow is two. Revenue growth — nine — is fifty-six percent of the entire return. Whatever cleverness the company brought to financial engineering, multiple management, or cost optimization has been weighed and dismissed. The only thing the company can still get paid for, a decade in, is having grown.
This is the most important pattern in the chart and the easiest to miss. The components that show up biggest at one year — multiple change and margin — decay fastest. The component that looks most modest at one year — revenue growth, the same ten points as the others — is the one that holds across every horizon. Revenue growth does not get bigger over time. The other three get smaller.
BCG's own one-line summary is exact: revenue growth drives from thirty-two to fifty-six percent of total shareholder return depending on the time horizon. The longer you hold, the more of your return is growth, and the less of it is anything else.
Normalized to a hundred percent at each horizon, the trade is unmistakable. Multiple change goes from a third of the return at one year to an eighth at ten. Revenue growth goes the other way, from a third to over half. More than half of any long-run TSR comes from having grown.
Why cost-cutting feels safer but isn't
Given the chart above, you would expect every executive team to be obsessed with revenue growth. They are not. Most talk about growth and act on costs. The asymmetry is consistent enough to deserve an explanation.
Cost actions feel safer for four reasons. They are bounded — a five-million-dollar procurement saving executes cleanly; growth bets can fail, deliver years late, or work in ways no one can attribute. They are visible — a cost cut hits next quarter's P&L; a growth investment may not show for two or three years, and boards measure what they can see in two quarters. They are controllable — you can consolidate a vendor by Friday; you cannot win the next ten enterprise customers by Friday. Growth depends on demand, competition, and timing — none of which you control. They are the operator's playbook — most senior management trained at firms where cost discipline was the recognized form of seriousness. Growth is taught at fewer places.
Each of these is real. None of them changes the math. The chart does not say cost cutting fails — it says cost cutting compounds slowly and decays quickly. A team that ships a one-time margin program from twelve to fourteen percent does itself proud. A team that grew revenue at fifteen percent for eight years has done something roughly five times more valuable on the BCG numbers.
The deeper problem is that cost discipline can damage the thing that produces growth. A real cost program closes territories, defers engineering, cuts brand spend, exits the next adjacent market, and makes the most ambitious people in the building reconsider whether they should still be there. Some of those decisions are correct. Some are how a growth business quietly converts itself into a yield business and notices, three years later, that the multiple did not just contract — it left.
Cost dollars and growth dollars are not interchangeable. A cost dollar saved is a permanent dollar of margin at the exit multiple. A growth dollar produced is recurring revenue at the exit multiple, plus — if the BCG chart is right — multiple expansion on top. The two do not weigh the same.
When cost actually matters
Cost discipline is not a vice. It is also not a strategy. Three situations where the right answer is genuinely cost, not growth:
The business is unprofitable. If unit economics don't work, growth makes the problem larger. Fix the unit economics first; turn the engine on once each marginal customer is value-additive. Most failed growth-stage companies didn't fail because they grew slowly. They failed because they grew before the unit economics could carry the weight.
There is real structural waste. Some cost is residue from decisions made years ago for circumstances that no longer apply. A duplicated function across a roll-up. A vendor relationship that survived a leadership change. A real-estate footprint sized for a workforce that no longer exists. Cleaning that up is not strategy; it is hygiene. Hygiene is necessary, and skipping it makes every other lever harder to pull.
Capital allocation discipline is missing. Sometimes the issue isn't too much cost — it's no control over which costs are allowed to grow. A company that has lost the habit of asking, every year, whether each line is still worth the spend accumulates weight that crowds out the next investment. The fix isn't cutting; it's forcing every dollar to re-justify itself.
In all three cases, the work is necessary, but it is not the long-run game. Discipline buys you the right to grow. Growth is what produces the return.
Closing
The Credit Suisse curve is a market mechanism. It tells you what the market will pay, and it pays disproportionately for growth — particularly when the business is high-quality. The BCG chart is an outcome statement. It tells you what shareholders received, and over ten years, they received mostly growth.
Both say the same thing. The market and realized returns agree. Cost is real, necessary, sometimes the right answer. Cost is also bounded, one-time, and decays. Growth is the only term in the value equation that keeps paying as long as the business produces it.
The operators I've watched compound the most wealth understood this in their bones. They were disciplined about cost without being romantic about it. Discipline was the price of admission, not the game. The game was growth. They were unreasonable about growth in exactly the way they were reasonable about everything else, because the math gave them no other choice.
In the long run, the market is a weighing machine, and the thing it weighs is growth.
Related from the library
- The Importance of Going Fast — same Credit Suisse curve, applied to the time dimension: speed pulls break-even forward and earns the higher multiple sooner.
- Being Good Matters More Than Ever — BCG Henderson Institute on the 38-point EBIT spread between top- and bottom-quartile operators. Capability investment beats cost-cutting; the spread is the evidence.
- The Career Is a Competency Weighing Machine — Graham/Buffett: short-run voting machine, long-run weighing machine. Same logic at the firm level — the long run weighs growth, not optics.
Sources
- Credit Suisse Corporate Insights — Incremental Growth Curve, Exhibit 5 (the chart in §1).
- Justin Manly, Jeremy Kuriloff, Ketil Gjerstad, David Simins — “Your Revenue Strategy Depends on Your Starting Point”, BCG, September 2024 (Exhibit 1: sources of TSR for top-quartile performers across 1-, 3-, 5-, and 10-year horizons).
Source notes for the exhibits: Exhibit 1 recreated from Credit Suisse Corporate Insights, Incremental Growth Curve, Exhibit 5. Exhibit 2 recreated from BCG, “Your Revenue Strategy Depends on Your Starting Point” (Manly, Kuriloff, Gjerstad, Simins, September 2024), Exhibit 1.