The Anatomy of a Compounder: How 7 Great Companies Actually Created Shareholder Returns.
Seven public-company five-year windows decomposed into the five drivers of equity return — volume, price/mix, margin, multiple, and leverage — using Reinard's logarithmic model. What actually creates durable shareholder returns?
The Anatomy of a Compounder
How 7 great companies actually created shareholder returns
Every great stock return has a story hiding underneath the headline number. This article tears apart seven famous compounders to answer a deceptively simple question: where did the return actually come from? The answer is almost never what it looks like from the outside.
Before the math: why returns are almost always misread
Here is the simplest way to think about equity returns. Every stock that goes up over time does so for one of five reasons — and only five:
- Selling more units (volume growth)
- Charging higher prices (price & mix)
- Earning more margin on each dollar sold
- Getting a higher valuation multiple on those earnings
- Changing the capital structure (debt, buybacks, dividends)
That's it. Every compounder, every 10-bagger, every "why did this stock go up so much?" story — it's some combination of those five things.
The trouble is that headline returns hide which lever did the work. A 25% annual return from "the market suddenly paid twice as much for earnings" is structurally different from a 25% return from "the company sold five times as many units." The first is fragile. The second tends to repeat.
Why decomposition matters
Investors who skip this step make a predictable mistake: they congratulate management for returns the market handed them, or they project returns that can't repeat because they weren't operational in the first place.
- Prevents false attribution — separates what management did from what the market gave them
- Identifies repeatability — operational returns recur; multiple re-ratings are one-shot
- Improves forecasting — you can't project what you haven't measured
- Reveals hidden risk — a 3× driven by leverage is not the same as a 3× driven by volume
- Sharpens pattern recognition — you start to see archetypes, not just individual cases
- Separates luck from skill — the hardest and most important question in investing
This article takes seven public companies, each over a five-year window, and does exactly this decomposition. They are chosen not because they are the highest-returning companies, but because each one's shape is structurally distinct. NVIDIA is "every lever on at once." Costco is "the market changed its mind about what predictability is worth." AutoZone is "financial engineering without an LBO." Eli Lilly is "one breakthrough that repriced the entire pipeline."
Together, they cover every major archetype in modern public-market compounding.


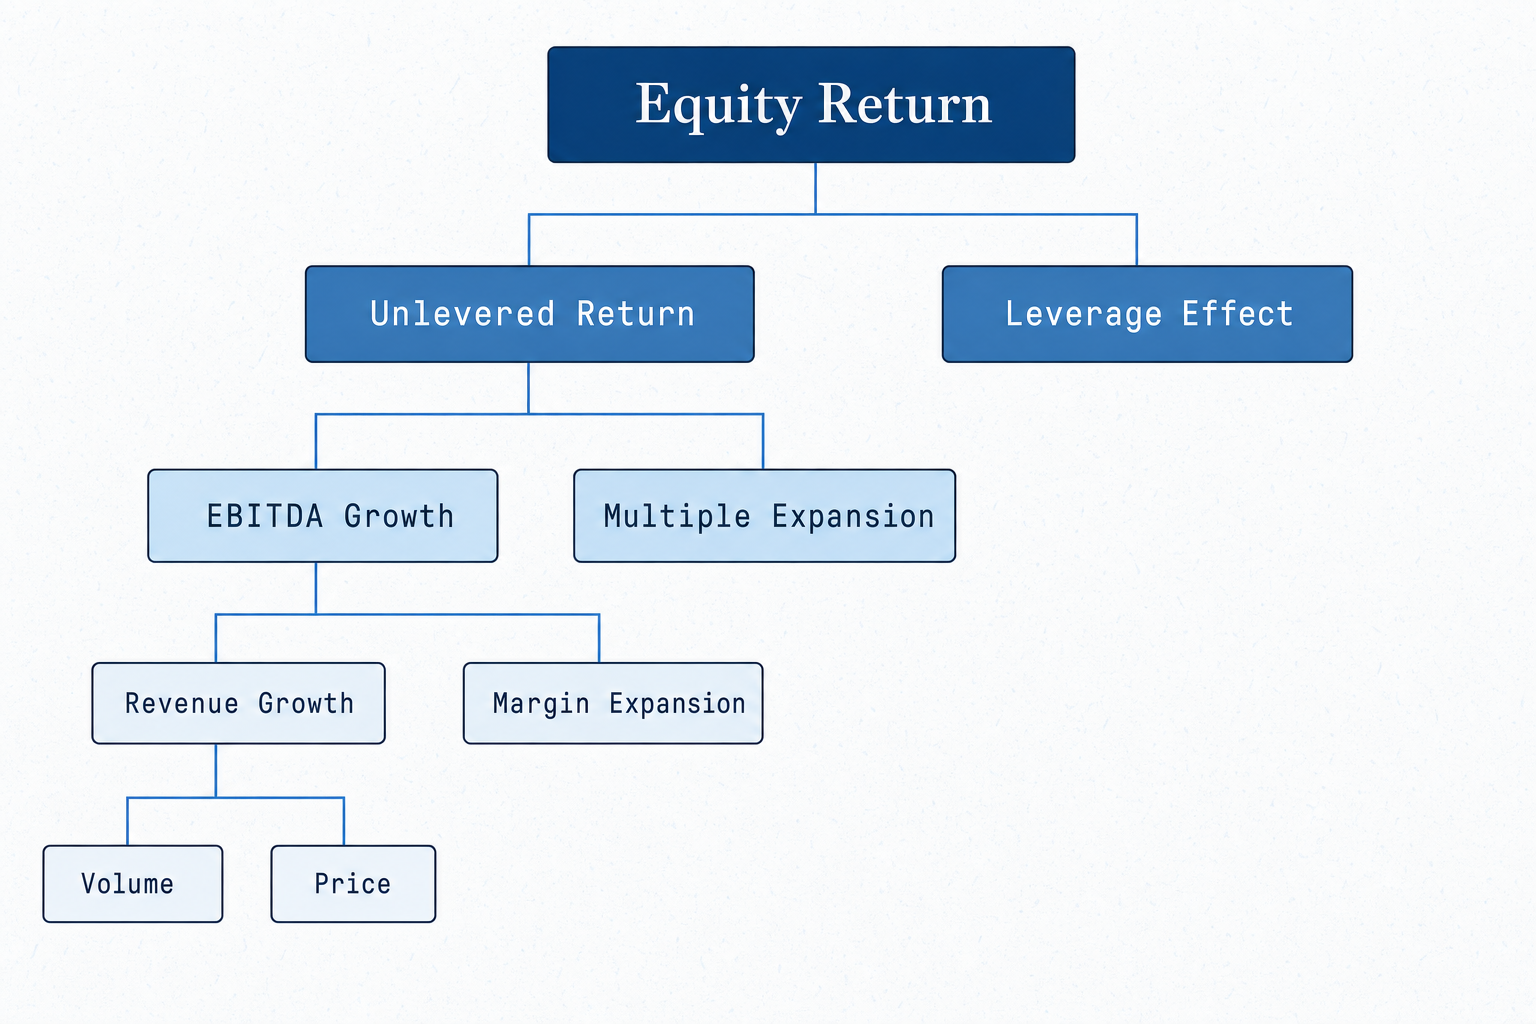
The hierarchy — from gross return to operating drivers
The framework used here is Reinard's Private Equity Value Creation Analysis, restricted to single-company nodes. Three branches climb from the equity-return trunk: an operating branch (teal) that ends in unit growth, price, gross margin, SG&A leverage, and D&A scaling; a multiple branch (violet) that splits into market re-rating and a deserved company-specific re-rating; and a leverage branch (amber) that captures the bridge from enterprise growth to per-share equity growth — debt paydown, dividend recaps, and buyback-driven equity-base compression. Every box carries its Reinard symbol and the ratio it computes; the tree multiplies upward to MOIC.
This is strictly a single-company decomposition. Fund-level mechanics — management fees, carried interest, fund-ownership impact, J-curve, capital-call timing — are out of scope; the fund-level branches are stripped, leaving the operating-and-capital-structure tree that applies to any equity holder, public or private. The key property of the logarithmic version is that every leaf's contribution is independent of every other leaf — there are no cross-terms to allocate by hand, and the percentages sum cleanly to 100%.
The leverage layer
Two equity returns from the same enterprise can differ by 1.5× or more, just from how the capital structure was built around the business. That factor is the leverage effect: the bridge from how much the enterprise grew to how much an equity holder's claim grew.
In its simplest form, leverage is debt: a company that paid down $5B of net debt over the period grew its equity by $5B more than its enterprise grew. In a public-market context, leverage shows up in two more interesting forms. Buyback-driven equity-base compression is the AutoZone shape — the enterprise grew at a normal rate, the share count shrank by ~30%, and per-share equity grew at a much higher rate as a result. Sustained leverage with periodic recap dividends is the TransDigm shape — net debt is held at 6–7× EBITDA forever, and every few years the company refinances and pays a special dividend out of the new debt. The equity holder receives a stream of distributions on top of mark-to-market growth.
Both forms are mathematically equivalent — they compress the equity base relative to enterprise growth. Both depend on a stable cash flow that can carry the debt. Neither shows up on the income statement, which is exactly why the headline operating return understates what the equity holder earned.
EBITDA growth — revenue × margin
EBITDA growth decomposes cleanly: revenue growth at constant margin, plus margin expansion at constant revenue. The log identity is exact — ln(EBITDA growth) = ln(revenue growth) + ln(EBITDA-margin expansion) — which is why the logarithmic model is the only one that gives independent contributions. The conventional ($) and derivative models both carry a cross-term that has to be allocated by hand; the log model does not.
In practice, the question is which lever did the work. NVIDIA's EBITDA grew ~25× — and in log terms, ~80% of that was revenue and ~20% was margin. Costco's EBITDA grew 1.8× — and in log terms, ~95% of that was revenue and ~5% was margin. Same identity, very different shape. The same headline growth-rate can hide opposite stories about what the company actually did.
Revenue — unit growth and price
Revenue is a P×Q product. Decompose it the same way every product line is built: how many units (or members, or seats, or warehouses) and at what price (or ARPU, or ASP). Volume and price/mix are independent in log terms — they multiply the way they should.
The most informative cases are the ones where the split is lopsided. Constellation Software's revenue grew 2.9× over five years, almost entirely on volume — they bought hundreds of small vertical-software businesses, each adding incremental units of acquired ARR. Apple's revenue grew 1.44×, with iPhone units roughly flat and the lift coming from Services mix and ASP — almost entirely a price/mix story. NVIDIA grew 12× with both levers firing roughly equally. The split tells you which engine is running.
Mix is part of price. When a product line shifts from a $300 SKU to a $30,000 SKU, the company is not "raising prices" — it is changing the basket. Either way, in log space, ASP went up, and the contribution lands in the price/mix leaf. If mix is the dominant story, separate it out in narrative; arithmetically it lives where price lives.
Margin — gross margin, operating leverage, and D&A
Margin is where the income statement starts to lie. "Margin expansion" reads as a single number on the P&L, but it is a sum of three structurally different things: COGS efficiency, fixed-cost leverage, and capex efficiency.
Pull them apart the way a practitioner would. Gross margin moves with input costs, COGS structure, and price/mix. Operating margin (above EBITDA) adds the SG&A picture — fixed costs scaling slower than revenue is the classic operating-leverage story. EBITDA margin adds D&A back in — D&A scaling slower than EBITDA tells you the company is getting more EBITDA per dollar of capacity.
Most public companies move all three at once, and the temptation is to treat margin expansion as one thing. Don't. NVIDIA's gross margin moved 13 points (input efficiency on H100 generation), but its operating margin moved 36 points (massive SG&A leverage as revenue scaled into a fixed engineering and sales base). The vast majority of NVIDIA's margin story is fixed-cost leverage, not gross-margin lift — different from what the headline reads, and very different from a company whose margin expansion is driven by COGS-side efficiency.
Multiple expansion — market vs intrinsic
The multiple is what the market pays per dollar of EBITDA. It moves for two structurally different reasons. Either the comp set re-rates — every name in the sector trades at a higher multiple, regardless of what your specific company did — or your specific company earns a higher multiple than its comps because the market believes its growth is more durable, its margins more defensible, or its capital efficiency more attractive.
Honest decomposition: anchor the entry-period sector EV/EBITDA, anchor the exit-period sector EV/EBITDA, and split the multiple change. If 80% of the lift came from sector re-rating, your management didn't do that — they were carried by tide. If 80% came from outpacing the comps, that is a deserved re-rating and the management gets the credit. Costco's multiple moved from 22× to 50× in five years — most of that move is the sector re-rating, not Costco-specific. Eli Lilly's multiple roughly doubled — almost all of that is company-specific, because the GLP-1 mechanism repriced the entire pipeline relative to pharma comps.
This split also tells you what is reproducible. Market re-rating is a one-shot — a sector trades at a higher multiple, and the next five years rerun against the new baseline. Intrinsic re-rating is a story about the business, and tends to either continue, retrace, or extend.
The right-most column in each case-study table attributes a slice of the total equity return to a single component, in log space. The identity is multiplicative on MOIC and additive on the natural log:
ln(MOIC) ≈ ln(revenue ratio) + ln(EBITDA-margin ratio) + ln(multiple ratio) + ln(leverage ratio) + residual
Each row's share of total return is ln(component ratio) / ln(MOIC). This is Reinard's Logarithmic Model (Table 2.15), restricted to single-company drivers (no Fund Ownership Impact, Fees, or Carry). It has one property the absolute and derivative models do not: every component's share is independent of every other, so they sum cleanly to 100%.
Reading the table. Rows in shaded (cream) bands are parents; their "% of return" cell shows "—" because their share is the sum of their children. Rows indented with a leading dot are leaves; their percentages are the ones that sum to 100%. The leaves in every case study are: Volume, Price / mix (under Revenue growth); Gross margin, SG&A leverage, D&A leverage (under EBITDA margin Δ); Multiple Δ; Leverage Δ; and Residual / dilution. Add only the indented rows and you get 100%.
Two sub-conventions inside EBITDA margin. Gross margin contribution is ln(GM₂/GM₁) / ln(MOIC). SG&A leverage is the incremental from gross margin to operating margin: [ln(OM₂/OM₁) − ln(GM₂/GM₁)] / ln(MOIC). D&A leverage is the incremental from operating margin to EBITDA margin: [ln(EM₂/EM₁) − ln(OM₂/OM₁)] / ln(MOIC). The three sum to ln(EM₂/EM₁) / ln(MOIC), the full EBITDA margin contribution.
Leverage and residual. Leverage Δ captures the bridge from enterprise-value growth to per-share equity growth: net debt paydown, dividend recaps, and buyback-driven equity-base compression (1 / (1 − buyback%)). Residual / dilution catches share-count dilution from stock-based comp, approximation noise in stated multiples, special-distribution timing, and any unaccounted bridges.
Color semantics. Across the seven tables, percentage cells are color-coded: green for operational positive contributions, red for drags, purple for multiple expansion, amber for leverage. The dominant driver in each case is visually immediate without reading a single number.
To convert any leaf row's share back into an annualized contribution, multiply its share by the CAGR shown on the "Approx total equity return" row.
Case studies
NVIDIA · "Every lever on"
The cleanest "everything firing at once" decomposition in modern public markets. Revenue grew roughly 12× — half from datacenter GPU shipment volume on the A100 → H100 → B100 cycle, half from ASP and mix shift to datacenter SKUs at $25–40k versus prior-generation $5–10k.
What makes NVIDIA unusual is not the magnitude of growth. Hypergrowth companies exist. What is unusual is that every major return lever moved positively at the same time — volume, price, gross margin, operating leverage, and multiple expansion. That combination is extraordinarily rare. The one meaningful headwind is stock-based-comp dilution and a pullback from the intra-window multiple peak at exit.
Strip out the dilution and this is the textbook compounder shape. Operating performance alone — revenue × margin — accounts for roughly 104% of the total return in log terms. The multiple expansion adds another ~19%, and dilution and exit-multiple drift give ~23% back. The remarkable number is that margin only explains ~24% of the operating contribution; volume and price explain the other ~80%.
| Component | Detail | Value / Δ | % of return |
|---|---|---|---|
| Window | FY2020 (Jan 2020) → FY2025 (Jan 2025) | 5 years | — |
| Revenue growth | $10.9B → ~$130.5B | ~12.0× | — |
| · Volume / units | Datacenter GPU shipments scaled multi-fold on A100 → H100 → B100 cycle | ~3.5× | +40.2% |
| · Price / mix | Mix shift to datacenter; H100 ASPs ~$25–40k vs prior-gen $5–10k | ~3.4× | +39.5% |
| EBITDA margin Δ | ~30% → ~63% (full margin expansion) | +~33 pts | — |
| · Gross margin | ~62% → ~75% | +~13 pts | +6.1% |
| · SG&A leverage | OM ~26% → ~62%; SG&A ratio compressed faster than GM lifted | +~23 pts beyond GM | +21.8% |
| · D&A leverage | D&A grew slightly faster than capacity scaled — small drag relative to OM | −~3 pts beyond OM | −4.1% |
| EBITDA growth | ~$3.3B → ~$82B (= revenue × margin) | ~25× | — |
| Multiple Δ (EV/EBITDA) | ~22× → ~40× (intra-window peaks higher) | +~18 turns | +19.2% |
| Leverage Δ | Net cash both periods; minor buyback | ~0 | ~0% |
| Residual / dilution | Stock-based comp dilution + multiple drift vs stated peak | — | −22.7% |
| Approx total equity return | Split-adjusted close Jan 2020 → Jan 2025 | ~22.5× mid | 100% (~86% pa) |
NVIDIA was not just a growth story. It was simultaneously a volume story, a pricing story, a margin story, and a multiple story. All four pulled in the same direction, at the same time.
The hidden detail most people miss: the majority of the margin expansion is operating leverage (SG&A leverage at +21.8%), not COGS efficiency (gross margin at +6.1%). Revenue scaled 12× into a roughly fixed engineering and go-to-market base. That is a repeating mechanism as long as revenue keeps growing — which is why understanding the source matters.
Apple · "Financial engineering amplified a stable business"
Almost the opposite shape from NVIDIA. The stock 3.25×'d in five years on a modest operating story: revenue 1.44×, margin essentially flat. The bulk of the equity return came from two financial levers — the multiple roughly doubled (12× to 22×), and the share count shrank ~21% from sustained buybacks.
Here's the part most investors miss: Apple's operating story during this window was primarily about price and mix, not volume. iPhone units were roughly flat. The revenue lift came from Services growing its share of the mix — higher margins, recurring revenue, higher ASP. That's a durable mechanism, but a different one than an NVIDIA or a Constellation where units are doing the work.
The interesting part is not that Apple grew. The interesting part is how little operational growth was required to produce a 3× shareholder return once the market decided to reprice the cash flow stream and management kept relentlessly shrinking the share count.
| Component | Detail | Value / Δ | % of return |
|---|---|---|---|
| Window | FY2018 (Sep 2018) → FY2023 (Sep 2023) | 5 years | — |
| Revenue growth | $265.6B → $383.3B | ~1.44× | — |
| · Volume / units | iPhone units roughly flat-to-down; Services and Wearables grew | ~1.05× | +4.1% |
| · Price / mix | iPhone ASP up; mix shift toward higher-margin Services | ~1.37× | +26.7% |
| EBITDA margin Δ | ~32% → ~33% (small lift) | +~1 pt | — |
| · Gross margin | ~38% → ~44% | +~6 pts | +12.5% |
| · SG&A leverage | OM ~27% → ~30%; SG&A grew slightly faster than gross profit (negative leverage) | −~3 pts beyond GM | −3.5% |
| · D&A leverage | D&A drag offsets most of the OM lift | −~2 pts beyond OM | −6.4% |
| EBITDA growth | ~$85B → ~$127B (= revenue × margin) | ~1.5× | — |
| Multiple Δ (EV/EBITDA) | ~12× → ~22× | +~10 turns | +51.4% |
| Leverage Δ | Share count –~21% (split-adj.); intentional rise in gross debt → equity base ÷ 0.79 | ~1.27× | +20.0% |
| Residual / dilution | Approximation noise + remaining bridges (net-debt change, FX, modest dilution) | — | −4.8% |
| Approx total equity return | Split-adjusted close Sep 2018 → Sep 2023 | ~3.25× mid | 100% (~26.6% pa) |
Over half the return came from the market paying more for the same stream of cash flows — not from operational transformation. Add buybacks, and financial engineering accounts for roughly 70% of the five-year equity return.
This is not a criticism. It is a description. Apple's capital allocation during this window was exceptional. The question is whether the multiple can double again from 22×. That's a different question than whether the business keeps selling phones and services — and it's the one that matters for the next five years.
CCostco · "The market changed its mind about what predictability is worth"
Costco is one of the most fascinating decompositions in this set because almost none of the shareholder return came from operational transformation. Revenue grew 1.67×. Margin moved a few tenths of a percent. The business did exactly what Costco businesses do — add warehouses, grow members, pass through inflation.
And the stock 3.75×'d.
At some point, Costco stopped being valued like a retailer and started being valued like infrastructure. The multiple moved from ~22× to ~50× over five years. That ~28-turn re-rating explains roughly 62% of the total return. Strip it out and the equity return is ordinary: about 1.7× over five years, or 11% annually.
The market did not reward extraordinary growth. It rewarded durability — and it decided, mid-decade, that durability deserved a software-like multiple.
| Component | Detail | Value / Δ | % of return |
|---|---|---|---|
| Window | FY2019 (Sep 2019) → FY2024 (Sep 2024) | 5 years | — |
| Revenue growth | $152.7B → ~$254.5B | ~1.67× | — |
| · Volume / units | Membership growth + warehouse openings + member traffic | ~1.30× | +19.8% |
| · Price / mix | Inflation pass-through; ancillary & e-com mix gains | ~1.28× | +18.7% |
| EBITDA margin Δ | ~4.0% → ~4.3% (slight lift) | +~0.3 pts | — |
| · Gross margin | ~13.1% → ~12.6% (slight compression) | −~0.5 pts | −2.9% |
| · SG&A leverage | OM ~3.4% → ~3.7%; real SG&A leverage on rising scale | +~0.8 pts beyond GM | +9.3% |
| · D&A leverage | Small D&A drag against the OM lift | −~0.05 pts beyond OM | −0.9% |
| EBITDA growth | ~$6.2B → ~$11.0B (= revenue × margin) | ~1.8× | — |
| Multiple Δ (EV/EBITDA) | ~22× → ~50× | +~28 turns | +62.1% |
| Leverage Δ | Net cash; one large special dividend mid-window (treated as distribution) | ~0 (slight –) | ~0% |
| Residual / dilution | Multiple drift + small SBC dilution + special-div timing | — | −6.1% |
| Approx total equity return | Sep 2019 → Sep 2024 incl. special dividend | ~3.75× mid | 100% (~30.2% pa) |
A mediocre operational story wrapped in an extraordinary re-rating. The business grew well. But the return is a multiple story, not an operating story. Costco didn't suddenly become more profitable — investors decided predictability deserves a premium.
The question this raises for the next five years: can a 50× multiple on a near-zero-margin retail business expand further? The business will likely keep executing. But the re-rating has already happened.
AZAutoZone · "Leverage without an LBO"
AutoZone effectively engineered an LBO without ever leaving public markets. The operating story is genuinely modest — revenue 1.56×, gross margin slightly down, operating margin up less than a point. Ordinary by any measure.
But the share count went from 24.4M to 17.0M — a ~30% reduction — and the company maintained structural net leverage throughout. That combination compressed the per-share equity base by ~1.43×, which alone explains roughly a third of the total return.
The same operating story under a flat share count and zero net debt would have produced a return roughly half as large. The per-share equity return dramatically exceeded the per-business return. That is a deliberate financial-structure choice, sustained over years. It is one of the most underestimated levers in public-market compounding — and AutoZone has been its most consistent practitioner.
| Component | Detail | Value / Δ | % of return |
|---|---|---|---|
| Window | FY2019 (Aug 2019) → FY2024 (Aug 2024) | 5 years | — |
| Revenue growth | $11.86B → $18.49B | ~1.56× | — |
| · Volume / units | Modest store-count growth; commercial program expansion | ~1.20× | +16.1% |
| · Price / mix | Pricing held into inflation; commercial mix higher | ~1.30× | +23.2% |
| EBITDA margin Δ | ~22% → ~23% (small lift) | +~1 pt | — |
| · Gross margin | ~53.7% → ~53.0% (slight mix-driven compression) | −~0.7 pts | −1.2% |
| · SG&A leverage | OM ~19.4% → ~20.1%; modest SG&A leverage | +~1.4 pts beyond GM | +4.3% |
| · D&A leverage | Small D&A leverage | +~0.3 pts beyond OM | +0.8% |
| EBITDA growth | ~$2.6B → ~$4.2B (= revenue × margin) | ~1.6× | — |
| Multiple Δ (EV/EBITDA) | ~10× → ~14× | +~4 turns | +29.7% |
| Leverage Δ | Share count ~24.4M → ~17.0M (–~30%); persistent net debt → equity base ÷ 0.70 | ~1.43× | +31.6% |
| Residual / dilution | Approximation noise + remaining net-debt drift | — | −4.5% |
| Approx total equity return | Aug 2019 → Aug 2024 | ~3.1× mid | 100% (~25.4% pa) |
Buyback compression explains ~32% of the return — almost as much as all of revenue growth (~39%) combined, and more than multiple expansion (~30%). Operating margin moved less than a point across the entire window.
Share-count compression is one of the most underestimated drivers of public-market compounding. AutoZone has been its most disciplined practitioner — running what is effectively a permanent LBO with no exit clock and no PE sponsor taking the carry.
TDTransDigm · "PE on a public balance sheet"
If you wanted to build a PE fund and hold forever — no exit clock, no carry structure, just compound indefinitely — the architecture would look roughly like this. Sole-source aerospace SKUs with pricing power deliver organic revenue and margin growth. Sustained 6–7× EBITDA leverage delivers structural amplification. Periodic recap dividends return capital to equity holders without requiring a sale.
Roughly $73 per share in special dividends crossed in multiple recaps over the five-year window. Recap dividends alone account for ~32% of the total return — as much as all of operating performance combined (~52%). The multiple expansion at ~16% is almost an afterthought.
This is the LBO with no exit clock. And it works as long as the underlying cash flows are stable enough to carry the leverage.
| Component | Detail | Value / Δ | % of return |
|---|---|---|---|
| Window | FY2019 (Sep 2019) → FY2024 (Sep 2024) | 5 years | — |
| Revenue growth | $5.22B → ~$7.94B (organic + bolt-ons) | ~1.52× | — |
| · Volume / units | Aerospace aftermarket recovery + acquired SKUs | ~1.20× | +18.0% |
| · Price / mix | Sole-source / proprietary SKU pricing power; aftermarket mix shift | ~1.27× | +23.6% |
| EBITDA margin Δ | ~47% → ~52% | +~5 pts | — |
| · Gross margin | ~58% → ~60% | +~2 pts | +3.4% |
| · SG&A leverage | OM ~42% → ~46%; real SG&A leverage | +~2 pts beyond GM | +5.7% |
| · D&A leverage | Small D&A leverage | +~1 pt beyond OM | +1.0% |
| EBITDA growth | ~$2.5B → ~$4.1B (= revenue × margin) | ~1.65× | — |
| Multiple Δ (EV/EBITDA) | ~17× → ~20× | +~3 turns | +16.1% |
| Leverage / recap Δ | Net debt sustained at ~6–7× EBITDA; ~$73/share in special dividends across multiple recaps | large + (recap) | +32.2% |
| Approx total equity return | Sep 2019 → Sep 2024 incl. specials | ~2.75× mid | 100% (~22.4% pa) |
Recap dividends (~32%) account for as much of the return as all operating performance combined (~52%). Multiple expansion is a side dish. This decomposition reads like an LBO with no exit clock — structurally what a PE GP would build if they could hold forever.
The mechanism is elegant in its simplicity: take a business with durable pricing power and stable cash flows, lever it permanently, and return cash through periodic refinancings rather than through a sale. The equity holder gets the economics without the exit.
CSConstellation Software · "M&A is the strategy"
The cleanest single-lever compounder in this set. Revenue grew 2.9×, with ≥80% of that growth coming from acquired vertical-software businesses. Margin barely moved. Multiple barely moved. Almost all the return came from one lever — buying small vertical-software businesses at single-digit revenue multiples and adding their ARR to the consolidated entity.
The contrast with TransDigm is illuminating. Both run intensive M&A programs. Both deliver low-twenties IRRs. But TransDigm's bolt-ons are an organic-growth multiplier on top of pricing power and recaps. Constellation's bolt-ons are the growth. Strip out the M&A and the company is essentially flat. The model is durable as long as the universe of small vertical-software targets keeps replenishing — and so far, it has.
| Component | Detail | Value / Δ | % of return |
|---|---|---|---|
| Window | FY2019 (Dec 2019) → FY2024 (Dec 2024) | 5 years | — |
| Revenue growth | C$3.49B → ~C$10.07B (≥80% acquisition-driven) | ~2.89× | — |
| · Volume / units | Hundreds of acquired vertical-software businesses | ~2.60× | +81.0% |
| · Price / mix | Modest organic price; mix tilted to maintenance & recurring | ~1.11× | +8.8% |
| EBITDA margin Δ | ~25% → ~28% | +~3 pts | — |
| · Gross margin | ~30% → ~30% (flat) | ~flat | ~0% |
| · SG&A leverage | OM ~13% → ~14%; modest SG&A leverage | +~1 pt beyond GM | +6.3% |
| · D&A leverage | Acquired-intangible amortization light vs cash margin | +~2 pts beyond OM | +3.3% |
| EBITDA growth | ~C$0.9B → ~C$2.8B (= revenue × margin) | ~3.1× | — |
| Multiple Δ (EV/EBITDA) | ~24× → ~26× | ~+2 turns | +6.8% |
| Leverage Δ | Modest leverage funding deals; spin-out of Topicus FY21 treated as distribution | small + | +1.0% |
| Residual / dilution | Share issuance for acquisition financing + Topicus distribution mark | — | −7.3% |
| Approx total equity return | Dec 2019 → Dec 2024 (incl. Topicus distribution) | ~3.25× mid | 100% (~26.6% pa) |
~90% of the return came from a single lever — acquired-revenue growth, of which ~81 percentage points is volume from bolt-on acquisitions. The multiple barely moved (~7%). Margins contributed only marginally (~10%).
This is perhaps the most elegant machine in public markets: find a fragmented universe of small software businesses with sticky customers, buy them at 1–2× revenue, and let the aggregated scale compound. The alpha is entirely in the deal engine, not in the underlying business transformation.
LEli Lilly · "One breakthrough repriced the entire pipeline"
In 2019, Lilly was valued like a pharmaceutical company. By 2024, it was being valued like a platform company with a decade of visible runway. That distinction — not operational performance — explains roughly half of the 5.5× return.
The operating story is real and substantial. Revenue doubled on GLP-1 volume (Mounjaro, Zepbound), with a fixed R&D and SG&A base scaling into a much larger top line. Operating margin lifted 8 points. But the decomposition reads as a platform-shift compounder: one breakthrough mechanism unlocked both a unit ramp and a multiple re-rating, and the market paid for the rest of the pipeline preemptively.
Within revenue, roughly 31 percentage points is GLP-1 volume and only 10 points is mix. This is not a price story — it's a units story. The mechanism that won was getting drugs into patients at scale, not charging more per patient.
| Component | Detail | Value / Δ | % of return |
|---|---|---|---|
| Window | FY2019 (Dec 2019) → FY2024 (Dec 2024) | 5 years | — |
| Revenue growth | $22.32B → ~$45.0B | ~2.0× | — |
| · Volume / units | GLP-1 Rx volume (Mounjaro / Zepbound); legacy Trulicity expansion | ~1.70× | +31.1% |
| · Price / mix | High-priced GLP-1 mix shift; partial offset from gross-to-net | ~1.19× | +10.2% |
| EBITDA margin Δ | ~30% → ~38% | +~8 pts | — |
| · Gross margin | ~78% → ~81% | +~3 pts | +2.2% |
| · SG&A leverage | OM ~25% → ~33%; large SG&A + R&D leverage | +~5 pts beyond GM | +14.1% |
| · D&A leverage | D&A scaled with capacity build (small drag) | ~0 pt beyond OM | −2.4% |
| EBITDA growth | ~$6.7B → ~$17B (= revenue × margin) | ~2.5× | — |
| Multiple Δ (EV/EBITDA) | ~15× → ~30–35× (mid ~32.5×) | +~17 turns | +45.4% |
| Leverage Δ | Modest debt for capacity build; net debt rose; no buybacks | small + | ~0% |
| Residual / dilution | Approximation noise + remaining bridges | — | −0.6% |
| Approx total equity return | Dec 2019 → Dec 2024 | ~5.5× mid | 100% (~40.6% pa) |
Roughly half (~45%) of the return is the multiple paying for an option on the next decade. The other half is operational — ~41% revenue, ~14% margin. This is the defining characteristic of a platform-shift compounder: operating performance is real and substantial, but the market is pricing what comes next, not just what happened.
The GLP-1 mechanism worked. That changed the market's assessment of everything Lilly might do next. That is a deserved re-rating — and unlike Costco's re-rating, it came from something specific the company did. The question is how much of the pipeline optionality is already in the current multiple.
All case-study figures are approximate, drawn from public 10-Ks / annual reports / market data and rounded for readability. Verify line-by-line against primary filings before publication.
Most investors see outcomes. This article breaks down the machinery underneath — and asks which parts of that machinery are still running.
What actually creates great returns?
Looking across all seven decompositions, a few things become clear that would have been impossible to see from the headline returns alone.
The six archetypes
Archetype 1 · Everything firing
Archetype 2 · Financial engineering
Archetype 3 · Market re-rating
Archetype 4 · Structural leverage
Archetype 5 · Acquisition platform
Archetype 6 · Platform shift
The synthesis table
| Company | 5y MOIC | Primary driver | Operating* | Multiple | Leverage | Repeatable? |
|---|---|---|---|---|---|---|
| NVIDIA | 22.5× | Volume + price | ~104% | +19% | ~0% | Partially — needs AI capex cycle to continue |
| Apple | 3.25× | Multiple | ~33% | +51% | +20% | Low — multiple already doubled; buybacks can continue |
| Costco | 3.75× | Multiple | ~44% | +62% | ~0% | Low — 50× already priced in |
| AutoZone | 3.1× | Leverage | ~43% | +30% | +32% | High — buyback mechanism depends on FCF |
| TransDigm | 2.75× | Leverage + ops | ~52% | +16% | +32% | High — pricing power + leverage are structural |
| Constellation | 3.25× | Acquisitions | ~92% | +7% | +1% | High — depends on target-universe replenishment |
| Eli Lilly | 5.5× | Multiple + ops | ~55% | +45% | ~0% | Moderate — pipeline optionality already priced in |
* Operating return = volume + price/mix + margin contributions combined.
The conclusion most investors don't reach
The best compounders are not necessarily those with the highest growth. They are the ones whose return composition is durable and repeatable.
Some of the greatest stock returns in this set came from businesses with modest operational performance. Costco grew revenue 1.67× over five years — hardly extraordinary. Apple's iPhone unit count was flat. Yet both produced returns that beat the S&P by a wide margin.
The market did not reward growth alone. It rewarded durability. And in two cases — Costco and Apple — it paid a very high multiple for that durability. The question now, for both, is whether the multiple can expand again from here.
That distinction matters. A lot.
The most reproducible archetypes in this set are arguably AutoZone (financial structure runs continuously), TransDigm (pricing power + leverage is permanent), and Constellation (M&A machine has replenished consistently). These are businesses where the mechanism that drove returns in the last five years is structurally intact for the next five.
The market remembers outcomes. But outcomes are combinations of drivers. Some drivers repeat. Some do not. And most investing mistakes begin when those two are confused.