Should You Sell Your Business?.
An interactive simulator and decision framework for founders weighing a sale — powered by a mathematics heavy end to end calculator, supported by real world practicalities (acquired CEOs often get fired), and stress tested by experienced professionals.
Should You Sell Your Business?
Special thanks to several colleagues who reviewed this work and offered additional perspective: S.S. and M.T.
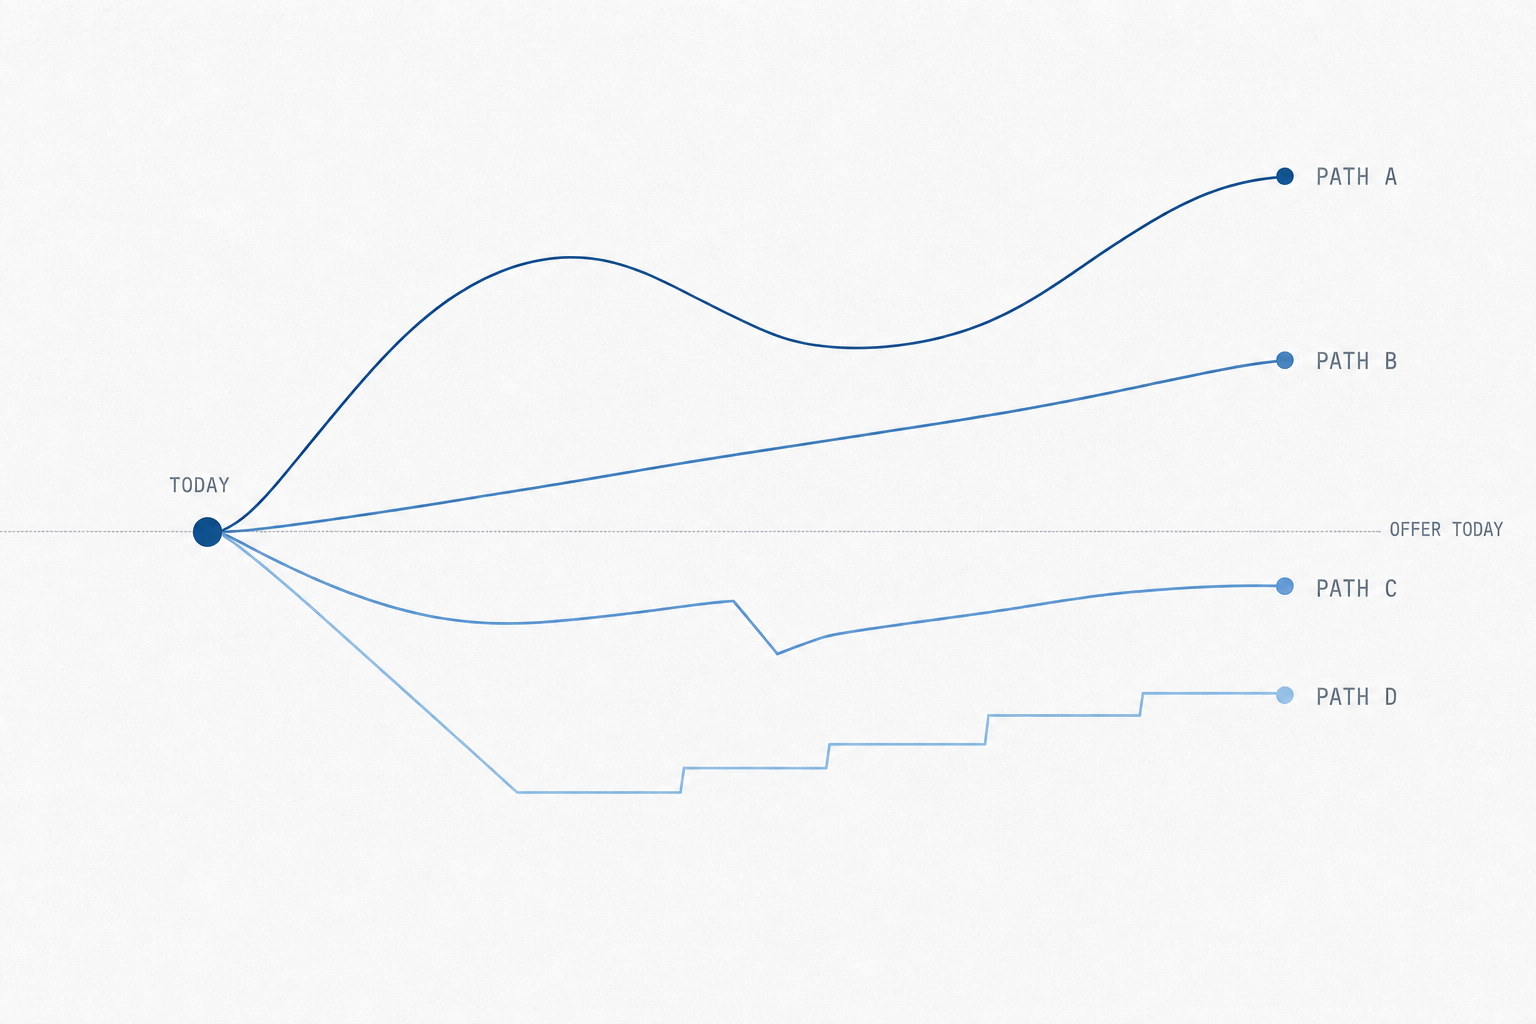
Receiving a term sheet from a financial buyer is not a single or a simple decision; it is a choice across at least four paths, against at least three objectives, conditioned by the life situation and preferences of the person doing the choosing. Any framework that collapses all that complexity into one IRR number is naive and over-simplified. The honest version is a distribution of potential outcomes. That is what we built.
This post examines four possible routes an entrepreneur can take, evaluated by three objectives. The options are: A) Sell control with a rollover, B) Minority / growth equity, C) Hold and harvest, and D) Recurring dividend recap. To simplify the analysis we assume three mock personas of entrepreneurs.
#1 TL;DR
If you only read 30 seconds of this post, read these five lines. They are opinionated. They will not be right for every reader.
- If your EBITDA is less than $3M, and revenue is growing more than 25% per year → hold. You have no real recap option, the offer multiple is below where it is going, and the rollover math punishes a small base.
- If your EBITDA is between $3M and $8M, and revenue is growing between 10% and 25% per year, and you are under 50 years old (or feel that way) → recap if covenant headroom allows; otherwise hold. A recurring dividend recap turns the company into a liquidity instrument and keeps you in control of the exit timing.
- If your EBITDA is between $8M and $20M, and revenue is growing less than 15% per year, and you are over 55 years old (or feel that way) → sell control with rollover, structure permitting. The recap math gets thinner as growth slows, the harvest path lengthens, and the rollover tail is what you can afford to take.
- If you have an intuition that growth is about to slow → renegotiate terms, do not accelerate the sale. The buyer's structuring is the rational counter to your private information, and the residual edge from "selling first" is small relative to the legal tail risk.
- Selling a minority position is almost never recommended unless you have a specific capital deployment plan that requires a partner you cannot get from a recap. The "PE enables you" pitch is mostly anecdote [8][9]; the data is index-like.
If you're between 50 and 55, the 3-question rubric below is what breaks the tie.
The rest of this post explains how we got to those conclusions and how you can generate your own conclusions for your own specific situation.
#2 Four paths, not one decision
Most "should I sell" conversations collapse to a binary: take the offer or don't. That framing is wrong because at sub-$20M EBITDA you have at least four legitimate liquidity strategies and they have different cash, tax, governance, and tail-risk profiles. The post models four explicitly.
Path A — Sell control with a rollover. The canonical PE control deal: founder sells 70–80% to a sponsor, rolls 20–30% into NewCo at the same per-share price, signs a 3–5 year employment agreement as CEO, and accepts an earnout overlay (median 31% of closing payment [22]) plus a seller note for some portion of the consideration. Governance shifts to the buyer. Cash at close is large; the rollover is a leveraged, illiquid stake whose realized value depends on a future exit timed by someone else.
Path B — Minority / growth equity. Sell 20–40% to a growth-equity sponsor; you keep control, governance is light-touch (board seat, protective provisions), the capital funds either a partial founder cash-out or a growth program or both. The realized economics depend more on continued execution than on a sponsor's exit-clock; the loss-ratio profile is materially different from buyout [8][9].
Path C — Hold and harvest. Decline the offer, run the business, take dividends, retain the option to sell each year if a better offer arrives. The simulator solves this as an optimal-stopping problem: at each year, the founder compares today's offer (if one arrives) against the expected value of holding one more year, with a 3% per year hazard of an idiosyncratic shock. The output is the value of waiting, decomposed from the value of growth. This is the implicit baseline any sale has to beat — and "doing nothing" has real failure modes — small-business hazard rates are not zero [13][14].
Path D — Recurring dividend recap. Not a one-shot. The founder keeps 100% of the equity and uses the credit market as a recurring liquidity tap. Each year, when cumulative incremental EBITDA × the leverage multiple has built up to roughly $5M of new debt capacity, refinance the facility and distribute the increment as a tax-advantaged dividend (return of capital up to basis, then cap gains). The covenant-breach hazard compounds with each tap, so this only works if growth holds; the moment EBITDA flattens, you are sitting on a tall debt stack with no more recaps available [12].
What we are not modeling, and why
#3 Why a single-point answer lies
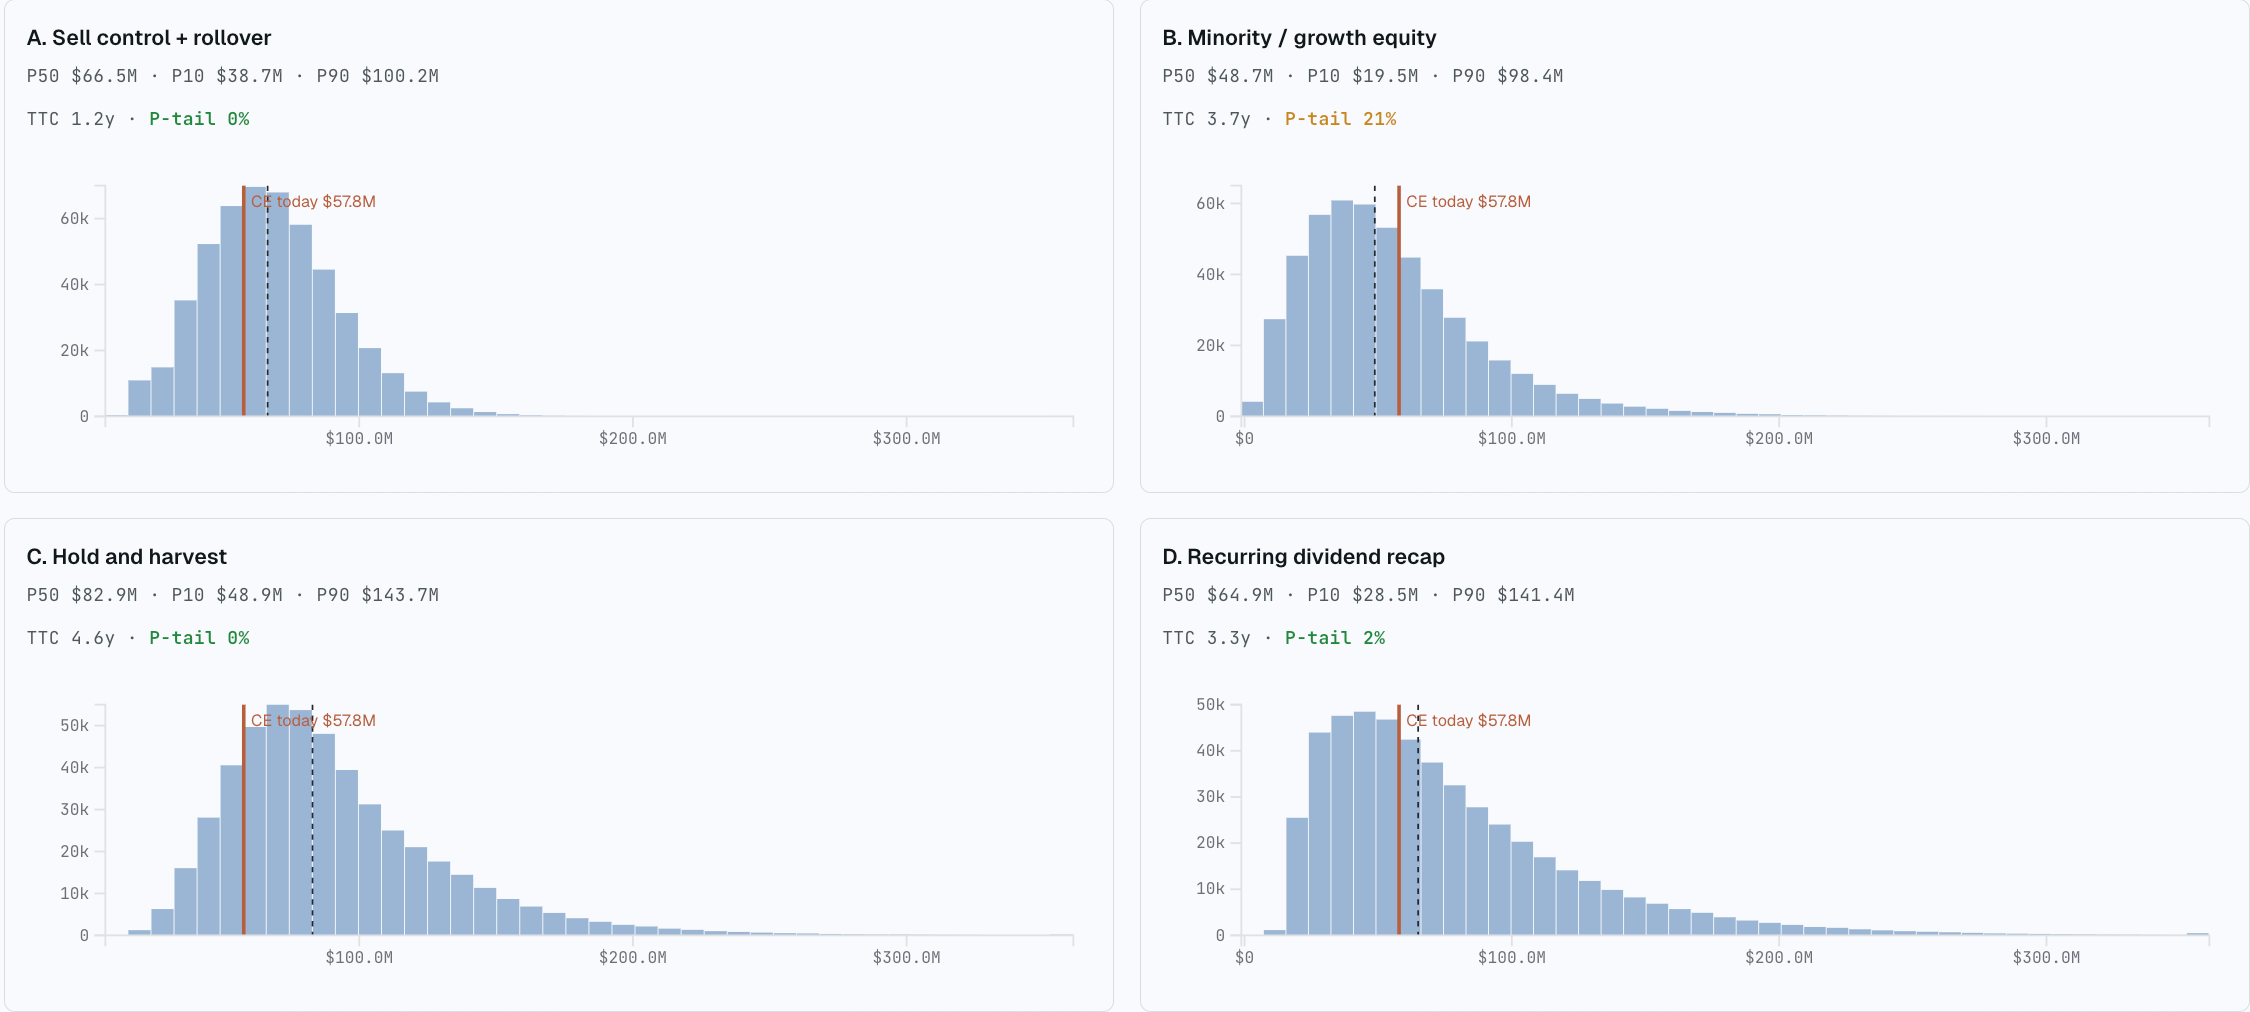
The standard banker output is a one-line answer: "your business is worth $X at Y times EBITDA." That number is a median. It hides everything that actually matters.
Path B (minority equity)'s modal outcome is meaningfully different from Path A (sell majority)'s even when the headline IRR looks similar — the loss ratio differs [8][9] and the friction terms have different teeth. Path C (hold & harvest) has its own left tail driven by small-business hazard rates [13]. Path D (dividend recap) depends on a credit market that was wide open in 2024 [11] but is not always.
None of this can be expressed by a single point. The only honest output is a distribution per path, summarized at the same percentiles, with the friction terms costed correctly. That is what the next sections build.
#4 Personas: three illustrative founder profiles
The same distribution reads differently depending on which founder is reading it. The simulator scores each path through three persona lenses; the scoring differs in discount rate and tail-risk weight, not in the underlying engine.
The Harvester — 55 years old or more, financially close to or past the line of personal independence, primary objective is locking in cash and protecting against the possibility of a bad year wiping out a decade of compounding. Discount rate 15%. Downside-tail weight 3x: a 10th-percentile outcome counts triple in the persona's scoring relative to a 50th-percentile outcome. Ranking: Path A (sell majority) > Path D (dividend recap) > Path B (minority equity) > Path C (hold & harvest). Path C looks dangerous at this weighting because the small-business shock hazard is real [13][14]; Path A with a small rollover and a clean earnout dominates.
The Builder — 35 to 50 years old, mid-career, identity is tied up with the business, the next ten years of operating feel like compounding rather than grinding. Discount rate 7%. Tail weight 1x: a downside outcome is a downside outcome but not catastrophic, because the Builder has a long human-capital tail and can recover. Ranking: Path B > Path C ≈ Path D > Path A. Path B reads well; Path A leaves a lot of undiscounted Path C upside on the table.
The Pivot — 45 to 60 years old, mentally already in the next chapter (a fund, a board portfolio, a non-profit, a different operating venture), the business is no longer the project. Discount rate 10%. Tail weight 2x. Time-to-liquidity weighs heavily because every month tethered to this business is a month not spent on the next thing. Ranking: Path A > Path B > Path C ≈ Path D. Path A with a clean exit ranks first; Path C and Path D rank tied-low because both require staying.
Same simulator output, three different rankings. The matrix in the Decision rule section substantiates each row.
#5 A compact 3-question rubric
If the five-line rubric did not resolve cleanly for you, three sharper questions filter most of the residual ambiguity. Each one is a single threshold. None of them require the simulator.
1) Is your EBITDA above $3M?
- Yes. Path D (dividend recap) is on the table. You can lever the company yourself, distribute tax-advantaged proceeds, and stay in control. The recap channel is real at this size [11][12].
- No. Path D (dividend recap) is mechanically unavailable — sub-$3M EBITDA cannot service the recap leverage stack at acceptable terms. You are choosing between Paths A, B, and C only.
2) Are you under 55 years old (or feel that way)?
- Yes. Your time horizon can absorb a 5 to 7 year rollover lock-in. The Builder persona's 7% personal discount rate makes Path A (sell majority)'s tail upside actually worth waiting for.
- No. The Harvester persona's 15% discount rate compresses any 5 to 7 year value into something close to today's certain-equivalent. Tail upside in the rollover is mathematically discounted to small. Path D or Path A with a small rollover dominates.
3) Does cash at close — net of taxes and fees — fund your post-deal life independently of the rollover and the earnout?
- Yes. Anything you keep in the deal is option value. You can take the structurally weak earnout if it raises headline price, and the rollover risk is bounded by what you can afford to lose.
- No. You are pricing the upside as if it were certain. Earnouts pay ~21¢ on the dollar of max on average [4]; rollovers under leverage compression hit zero on the cliff. The deal does not work unless you negotiate cash-at-close higher and accept a worse headline number.
Three "yes" answers point at sell-control-with-rollover or a clean recap depending on age. Three "no" answers point at hold-and-harvest. A mix is what the simulator is for.
#6 Run it yourself
#7 How the simulator is built
The engine is a Rust Monte Carlo. 500,000 trials per path, four paths, persona-weighted scoring layered on top.
Each trial samples the 14 drivers — independently for the exogenous ones (multiples, credit conditions, tax) and conditionally on growth for the endogenous ones (exit-multiple drift, covenant-breach probability, earnout payout). The friction terms are applied as deterministic cash-flow haircuts conditional on the sampled trial outcome (CEO firing event, covenant trip, earnout-threshold hit) rather than independent draws — that prevents over-counting probability mass at the joint tail. Path C (hold & harvest) uses backwards-induction optimal-stopping over a discretized (year × EBITDA × multiple) lattice; the policy is precomputed once per grid point, then a forward walk applies it per trial.
The output is a 144-grid-point JSON bundle (~3MB across files; ~21KB per grid point). Each file covers one combination of EBITDA × growth × entry multiple × leverage × persona, with per-path histograms at fixed quantiles (P10/P25/P50/P75/P90) for after-tax NPV, time-to-cash, and downside-tail probability. The front-end loads the file matching the slider state and renders D3 charts; tax rates and friction toggles are applied client-side as multiplicative adjustments so they don't require a recompute. The full source is at tools/mc-sell-business/ in the repo.
The user-input layer covers starting EBITDA, growth band, entry multiple, leverage, the persona selector, and six friction-term toggles. Everything else is fixed at the calibrated priors documented in the Limitations section.
#8 Three-layer stack
The simulator is three layers. Each layer is the previous layer with one piece of honesty added back.
Layer 1 — Single-outcome model. A single-outcome financial model runs exactly once, using a single fixed value for every assumption: one growth rate, one exit multiple, one hold period, no bad events. Nothing is random. Every input has been chosen to represent the "most likely" scenario, but those choices are still assumptions — and each one is a judgment call. One trial per path. Central values for every driver, no friction terms triggered, exit on schedule at the preserved multiple. This is what you find in an investment banker's CIM — useful as a starting point, but incomplete as a summary because it hides all the ways the outcome could differ from the central case.
Layer 2 — Scenario tree. Wrap the base model in observed-frequency branches: CEO firing, covenant trip, earnout payout buckets, multiple drift, recap success/failure. The deal-level IRR collapses meaningfully against the base model once these are paid for. This is what a competent PE memo does.
Layer 3 — 500,000 iteration Monte Carlo simulation. Replace the discrete branches with continuous distributions on the 14 drivers, calibrated so emergent branch frequencies match observed base rates [2][3][4][6][7][10][13][16]. The output is four histograms, one per path, scored at the same percentiles.
Layer A: the 14 distinct drivers to the model
The chassis is fourteen drivers that, between them, generate every outcome in the four paths. Some are exogenous (multiples, credit conditions, tax). Several are endogenous to the growth assumption — a business that grows faster also gets a higher exit multiple, sees lower covenant-breach probability, and is more likely to clear an earnout. Sampling these independently would over-disperse the distribution; the simulator correlates them through the growth driver.
| # | Driver | Central / range | Source |
|---|---|---|---|
| 1 | Starting EBITDA | $1–20M (user input; sub-$3M tier loses Path D) | — |
| 2 | Revenue growth (CAGR over hold) | 5–15%, lognormal | Lincoln Private Market Index[18], Golub Capital Altman Index[19] |
| 3 | EBITDA margin drift | ±200bps over hold | Lincoln Private Market Index[18] |
| 4 | Entry multiple | 5.5–6.7x EBITDA, $10–25M TEV tier | [6][7] |
| 5 | Exit multiple drift | ±1.5x vs entry, correlated with growth | [6][7] |
| 6 | Hold period | 3–7 years, median 5 | [12] |
| 7 | Leverage at close (Path A) | 4.0–5.5x EBITDA | [11] |
| 8 | Covenant-breach hazard | 4.5% steady-state, <$30M EBITDA cohort skew | [10] |
| 9 | CEO firing hazard (Y1/Y2/Y3/Y4+) | 15% / 25% / 20% / 10% | [2][3][16][17] |
| 10 | Earnout structure & payout | ~21% of max average; ~45% zero-payout | [4][5] |
| 11 | Rollover share & vesting | 10–30% rollover; 4-year vest, 1-year cliff | Goodwin Procter PE deal database[20], Goodwin equity-repurchase survey[21] |
| 12 | Recap availability (Path D) | Annual, conditional on credit cycle | [11][12] |
| 13 | Small-business shock hazard (Path C) | ~5–10% annual material-shock prior | [13][14] |
| 14 | Tax structure (federal LTCG, QSBS pre/post-OBBBA, state) | Path-conditional | [15][23] |
| 15 | Closing probability (LOI → close) | ~70% baseline, regime-dependent | [24] |
Two drivers carry most of the variance: #9 (CEO firing) for Path A (sell majority), and #10 (earnout payout) for any path that includes one.
#9 Decision rule
The decision rule is not "pick the path with the highest median NPV." It is: pick the path whose distribution dominates on your persona's weighting of after-tax NPV, time-to-liquidity, and downside-tail probability.
The matrix below substantiates the opening rubric one persona at a time. Each cell is a qualitative ranking (1 = best fit, 4 = worst) for that persona on that path, with the dominant reason in one line.
| Persona | A — Sell control + rollover | B — Minority / growth | C — Hold & harvest | D — Recurring recap |
|---|---|---|---|---|
| Harvester (55+, 15% disc., 3x tail) | 1 — locks cash, small rollover tail | 3 — keeps tail risk on the table | 4 — small-biz hazard at 3x weight is brutal | 2 — works if recap market stays open |
| Builder (35–50, 7% disc., 1x tail) | 3 — caps the upside that the persona is built for | 1 — capital + control + tail | 2 — undiscounted Path C (hold & harvest) optionality | 2 — strong if operationally appropriate |
| Pivot (45–60, 10% disc., 2x tail) | 1 — clean exit, time-to-liquidity wins | 3 — keeps the founder tethered | 4 — requires staying | 4 — requires staying and operating |
Two things to flag about this matrix. First, "1 = best fit" is qualitative until you run the simulator on your specific numbers — your starting EBITDA, your growth band, the actual term sheet on the table. The qualitative ranking is robust to small parameter shifts but a sharp move in any of the major drivers (multiple, leverage, earnout structure) can flip the order. Second, the matrix scores fit, not certainty: even the "1" cell still has a left tail you have to be able to live with.
#10 Your rollover is leveraged equity
The single most-misunderstood number in a PE term sheet is the rollover. The founder reads "you're keeping 20% of the equity in NewCo" as if it were a continuation of the 20% they already owned. It is not. The 20% pre-deal sits on top of an unlevered going concern. The 20% post-deal sits on top of the same going concern with 4–5x EBITDA of senior debt strapped to it [11]. That is a categorically different instrument.
Layered on top is the operating amplification: leverage triples your sensitivity to operating misses. A 200bp margin compression at the company level becomes a 600–800bp equity-level miss after debt service. A bad year is not a bad year for the rollover; it is a covenant trip, an amendment fee, a PIK overlay, sometimes a sponsor-led restructuring with a new pref ahead of the founder rollover. None of this shows up in the deterministic IRR the banker prints on the cover.
Layered on top of that is the governance amplification. The founder owns 20% of NewCo but no longer controls the exit timing, the CEO retention decision, the dividend policy, or the recap calendar. The 70% cumulative CEO firing rate over the hold [3] is not a footnote — it is the modal outcome for a founder who rolled into NewCo and was expected to keep operating. Once you are out as CEO you are a minority equity holder watching someone else's decisions compound your stake. There is no real exit option until the sponsor's exit; secondary sales of rollover equity are technically possible and practically rare.
The decision rule that follows from this is not "don't roll." It is "price the rollover as the leveraged option it is, not as a continuation of your existing equity."
#13 Sources
- Research methodology. A significant amount of the references found here were sourced through deep-research runs across three tools: Parallel.ai deep research, the Gemini Pro API deep research, and an Anthropic Managed Agent with a deep research profile.
- AlixPartners, 10th Annual PE Leadership Survey (2025) — 86% of PE-backed CEO turnover is investor-driven; 42% of portcos report ongoing CEO turnover well after close.
- AlixPartners / Vardis, 2nd Annual PE Survey (2017) — 73% of PE-backed CEOs replaced over the cycle; 58% within the first two years; "lack of fit with new strategic direction" the most-cited reason.
- SRS Acquiom, 2025 M&A Claims Insights — earnouts pay ~21¢ on the dollar of max on average; just over half pay anything; ~28% contested; 17% of paying deals required renegotiation.
- SRS Acquiom, 2024 Deal Terms Study — one-third of private-target deals carry an earnout; 68% have multiple metrics; earnout periods >4 years are essentially zero.
- GF Data, Small Deal Resilience (H1 2025) — TEV/EBITDA tiers: $1–5M ≈5.5x, $5–10M ≈5.6x, $10–25M ≈6.2–6.7x; size premium ~one full turn between sub-$10M and $10–25M.
- GF Data, Q3 2025 Middle Market M&A — average TEV/EBITDA across all middle-market 7.5x in Q3 2025; 2024 average 7.2x; $10–25M tier 6.2x→6.6x in 2024.
- Cambridge Associates, Growth Equity (2019) — capital loss ratio 13.7% growth equity vs 10–15% buyout; ⅔ of >20%/yr revenue-growth deals returned ≥2.0x MOIC; 28% of growth-equity capital generated >5.0x MOIC.
- Cambridge Associates, US PE/VC Benchmark CY2024 — calendar-year 2024 net returns: growth equity 8.8%, buyouts 7.9%.
- Lincoln International, Senior Debt Index (Q4 2024) — covenant default rate 2.4% in Q4 2024; six-year average 4.5%; smaller borrowers (<$30M EBITDA) skew higher; ~15% of portfolio addressed covenant issues via amendment.
- S&P Global / LCD coverage of 2024 dividend recap volumes — sponsor dividend recaps totaled $81.3B in 2024 (second-highest on record); average leverage on sponsored dividend-recap loans 4.8x EBITDA.
- PitchBook, Aging Buyout Portfolios (2024) — >40% of newly issued sponsor loans in Q1 2024 included a dividend recap; buyout hold periods reached 3.4 years.
- BLS Business Employment Dynamics — Year 1 establishment survival ~79–80%; cumulative 5-year survival ~51%; mature establishments converge to ~3% annual mortality.
- Federal Reserve, Small Business Credit Survey (2024) — >9 in 10 small employer firms experienced a financial or operational challenge in 2023.
- U.S. Treasury OTA, Working Paper 127 — QSBS (2024) — ~32,700 individual taxpayers per year claim a §1202 exclusion; median individual exclusion $2,810; 90th percentile $590,940.
- AlixPartners / Vardis (2017), PE-firing timing — 58% of PE-backed CEO replacements occur within the first two years.
- Heidrick & Struggles, PE Leadership Gap (2024) — >70% of PE-backed CEOs replaced during the average holding period; 55% of turnover unplanned and investor-instigated.
- Lincoln International, Lincoln Private Market Index (Q3 2024) — across ~5,750 PE-backed private companies, ~63.1% expanded LTM EBITDA in Q3 2024 (~37% flat or contracting); consumer sub-sector EBITDA grew 4.4% YoY with margin expansion of ~+1.6 ppts.
- Golub Capital, Altman Index (Q4 2025) — median revenue growth among ~110–150 PE-backed US middle-market private companies was +2% YoY in Q4 2025; quarterly median has historically tracked +2% to +8% across cycles.
- Goodwin Procter, Use of Equity Rollovers (2024) — rollover equity in mid-market PE acquisition agreements ($25M–$500M EV) rose from 46% of deals in 2020 to 57% in 2023.
- Goodwin Procter, Trends in Equity Repurchasing (Nov 2024) — for rollover at exit/departure: 82% of deals price good-leaver repurchase at FMV; 75% of deals price bad-leaver at "lower of cost or FMV"; 16% forfeit at $0; vested incentive equity in bad-leaver scenarios is forfeited in two-thirds of deals.
- Harvard Law School Forum on Corporate Governance, The Art and Science of Earn-Outs (2025) — earnouts appear in ~22% of non-life-sciences private deals in 2024; median earnout size is 31% of closing payment; only ~25% accelerate on a change of control, leaving the majority dependent on continued employment of the seller post-close.
- Greenberg Traurig, QSBS Regime Expanded Under "One Big Beautiful Bill Act" (July 2025); The Tax Adviser, QSBS gets a makeover (Nov 2025) — for stock acquired after July 4, 2025: per-issuer cap raised to $15M (or 10× basis); gross-asset threshold raised from $50M to $75M; tiered exclusion at 50% / 75% / 100% for 3yr / 4yr / 5yr holding periods; both caps indexed for inflation starting 2027. Public Law 119-21, signed July 4, 2025.
- LOI-to-close conversion. ~70% baseline cited by the Parallel.ai deep-research synthesis [1], conditional on macro state and buyer type; financing pullback and re-trade are the two largest derailers. The simulator's process-cost figure (~4% of Path A median) bundles partial banker fee, legal, and ~6 months of internal distraction with customer-leak overhang.