Teamshares Teardown: Technology Enabled Serial Acquirer that Bought Over 90 Small Businesses.
A teardown of Teamshares' deal math, firm math, dilution mechanics, and real moat: not the financial structure, but the operating system required to make it work.
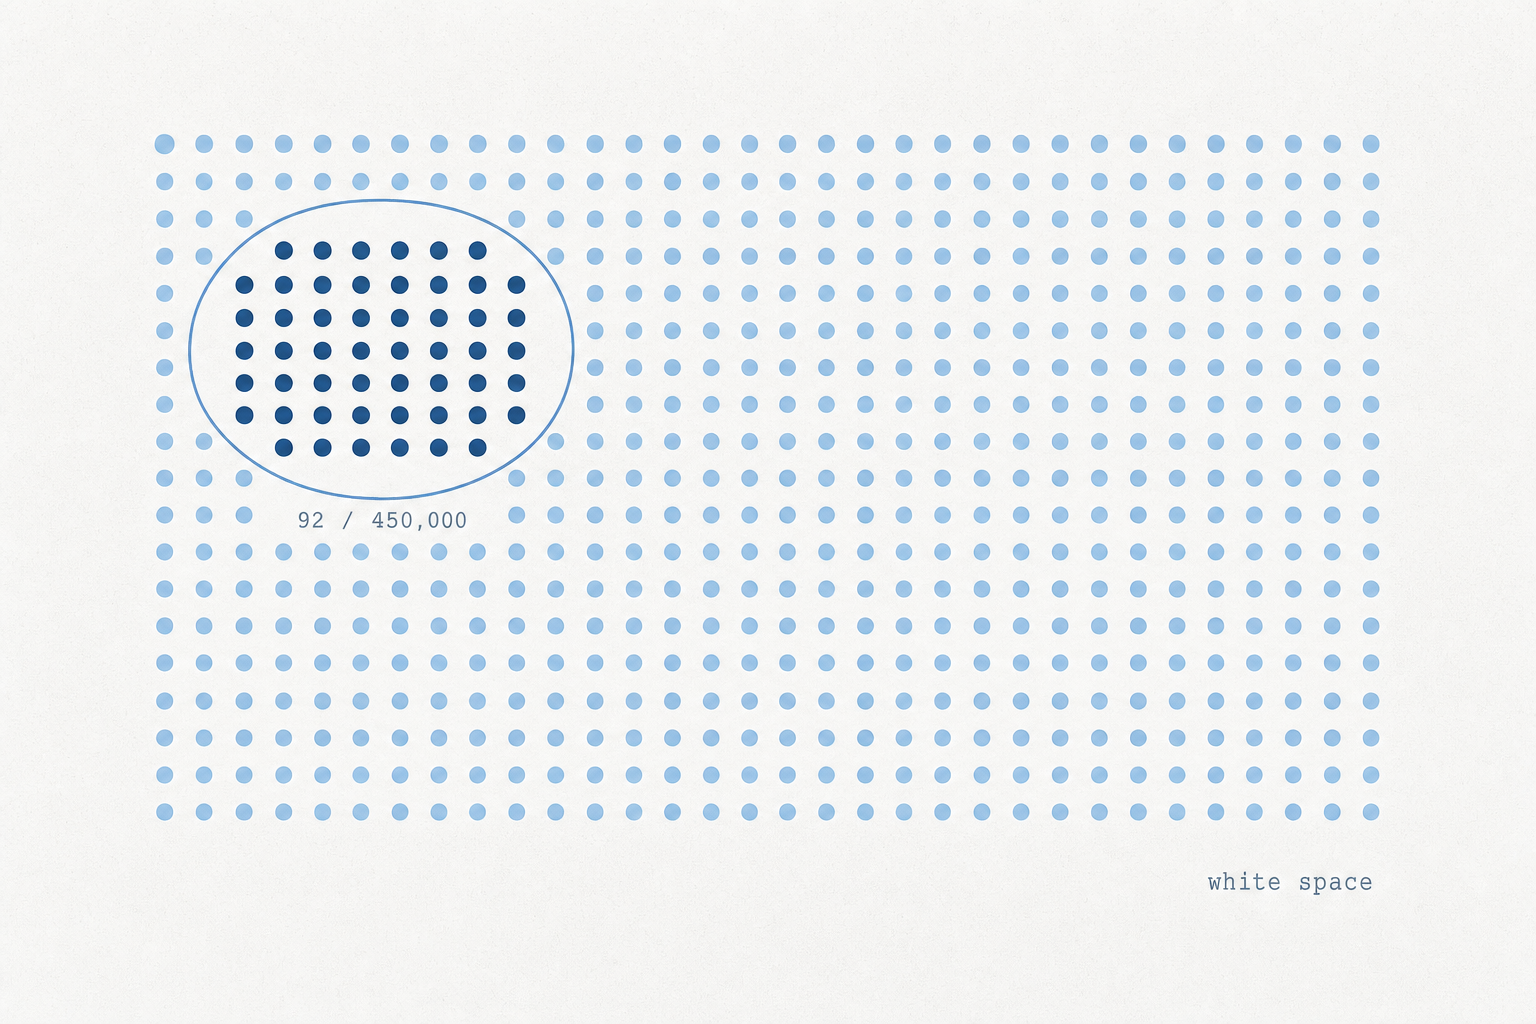
Teamshares buys profitable, retiring-owner small businesses at 4–6× EBITDA, gives ten percent of every company to its employees on day one, and runs them under a corporate platform that sources, finances, and staffs each deal. It now owns ninety-two such companies1. This piece pulls apart the deal math, the firm math, and the dilution mechanics to answer one question: is Teamshares a proprietary financial innovation, or a difficult operating system wrapped around very copyable finance?
- Buy profitable, retiring-owner SMBs at 4–6× EBITDA — at scale, programmatically.
- Finance each deal: ~3× senior debt + ~1× seller note + ~1× equity check.
- Grant 10% of every acquired company to employees on acquisition day.
- Dilute the holdco stake over 20 years via subsidiary cash-flow-funded repurchases — until employees own ~90%.
- Hold forever. Return = distributions + annual buyback proceeds + a terminal 10% residual. No exit, no flip.
- Watch the clocks. The model works only if debt reprices down, overhead amortizes across enough subsidiaries, and president quality holds as acquisition pace rises.
The thesis in one paragraph
The thesis: Teamshares deploys a financial engine that is at its core not differentiated, and therefore copyable. There is enough white space in the underlying market that a competitor can coexist beside Teamshares for a decade without crowding it out. What's hard to replicate is the operating model — the sourcing funnel, the president pipeline, the brand with retiring sellers, and the corporate scale that makes overhead per company approach zero. The real underwriting question is not whether the small-business acquisition math works. It is whether Teamshares can cross the scale threshold before debt cost, corporate overhead, or operator quality breaks the curve.
The rest of this post is a teardown of Teamshares' SEC filings1, supplemented by management commentary at the March 31, 2026 Investor Day2, KPMG's going-concern audit opinion3, and the author-derived model outputs built from those filings.
What Teamshares is — and how money moves through it
Teamshares Inc. was incorporated in Delaware on June 28, 2019 by Michael Brown and Alex Eu (both ex-Perella Weinberg Partners) together with Kevin Shiiba. Since then, this is what they have accomplished:
Source: Live Oak / Teamshares S-4/A.
The acquisition flow sets the entry math. The operating flow decides whether the deal pays back. The holdco flow governs whether the firm-level math works. Reading deal-level numbers as firm-level returns is the single most common analytical error in coverage of this company.
The deal math, per acquisition
At the acquisition layer, this is a familiar small-business acquisition trade — except for one thing. Teamshares does not exit. The acquisitions are perpetual. There is no five-year hold, no flip, no IPO of an individual subsidiary. What replaces the exit is a 20-year employee-ownership transfer that this teardown treats, for sponsor-perspective modeling purposes, as a forced-repurchase arc: each year, the subsidiary transfers value from the holdco-owned stake toward the employee pool at fair value. Over the full arc, the sponsor's economic ownership of any given subsidiary collapses from 90% (after the initial 10% pool) toward 10%, and the subsidiary becomes ~90% employee-owned. That is what makes the slogan "sell to your employees, not to PE" literally true, and it's what makes a return calculation built around an exit (the way most private-equity models are built) the wrong frame. The 90% endpoint here is the economic endpoint of the buyback arc, not a claim that every employee receives identical ownership or voting treatment.
So the model below isn't a five-year LBO. It's a perpetual-hold model where the sponsor's return comes in three streams: ongoing distributions while it still owns the company, cash from the buyback as the subsidiary repurchases its own equity at fair value, and a residual 10% stake at the end of the buyback that the sponsor keeps in perpetuity. The numbers in the first table below are management's own; the output table after it is my representative teardown.
| Lever | Value | Note |
|---|---|---|
| Target EBITDA range | $0.5M – $5.0M | Per acquired company |
| Entry multiple | 4x – 6x EBITDA | Stated programmatic band |
| Senior debt | ~3.0x EBITDA | Secured at company level |
| Seller note | ~1.0x EBITDA | Bullet, 3–10 yr term, mid-single coupon |
| Equity check | ~1.0x EBITDA | Per $1M of EBITDA acquired |
| EBITDA → unlevered FCF | 75% – 85% | Stated target; actuals "in excess of 75%" |
| Stated deal-level RoE | 30% – 40% | Live Oak Reasons memo · Brian Gaebe, Investor Day2 |
| Unlevered FCF yield (target) | 15% – 20% | Of purchase price |
Company-disclosed inputs Deal-level economics, as Teamshares describes them. Source: SEC S-4/A — "Our Platform"; Live Oak Reasons for the Business Combination — "Capital Efficiency".
Deal-level RoE, defined
One layer of measurement matters at the entry point: the EBITDA being purchased here is more accurately EBITDAC — EBITDA plus owner's compensation. Teamshares targets companies with roughly $0.5–$5.0M of EBITDA per acquired company, before any owner-compensation add-back. In that size band, owners routinely run personal expenses through the company and pay themselves excessive compensation, so standard EBITDA understates real earnings power by exactly that amount. A 5x EBITDAC is a different price than a 5x EBITDA; any clone underwriting in this band has to make the same add-back or get the deal economics wrong.
For a single acquisition of a company with $1M of EBITDA, the consideration is as follows: $5M purchase price, $3M of senior debt at roughly SOFR+spread, $1M of seller financing at ~6%, $1M of equity. Year-one unlevered FCF is ~$0.80M. Senior interest at 9.5% on $3M is $0.285M; seller interest is $0.060M. The first ~7 years' FCF mostly goes to amortizing the senior. After that, the company starts cutting checks back to the holdco and starts repurchasing the holdco's stake on behalf of the employee pool. The model sums all of that over 20 years — distributions while owning, buyback proceeds as the holdco's stake is unwound, and a residual stake at the end.
The table below shows the model output for a representative $1M-EBITDA acquisition under default assumptions: 1.0× EBITDA, 5× entry, 3× senior at 9.5%, 1× seller at 6%, 80% FCF conversion, 5% organic growth, 10% initial employee pool, 10% sponsor terminal ownership, 20-year buyback period, 7-year senior amortization. The table shows six representative years; the lifetime totals are summarized below it.
| Year | EBITDA ($M) | Enterprise value ($M) | Sponsor ownership | Distribution ($M) | Buyback proceeds ($M) | Total to sponsor ($M) |
|---|---|---|---|---|---|---|
| Y1 | 1.05 | 5.25 | 90% | 0.29 | 0.21 | 0.50 |
| Y4 | 1.22 | 6.08 | 78% | 0.43 | 0.24 | 0.67 |
| Y8 | 1.48 | 7.39 | 62% | 0.51 | 0.30 | 0.81 |
| Y12 | 1.80 | 8.98 | 46% | 0.47 | 0.36 | 0.83 |
| Y16 | 2.18 | 10.91 | 30% | 0.38 | 0.44 | 0.81 |
| Y20 | 2.65 | 13.27 | 10% | 0.18 | 0.53 | 0.71 |
Cumulative Y1–20, interpolated across the full arc.
Cumulative Y1–20 cash received as the sponsor stake unwinds.
10% × Y20 enterprise value, kept in perpetuity.
On a $1.0M initial equity check.
Total cash value returned ÷ initial equity.
20-year equivalent; actual IRR depends on cash-flow timing.
Value attribution on the sponsor return
Read: the model does not work because Teamshares keeps a giant terminal slug. It works because the sponsor is paid twice before the end state: ordinary distributions first, then fair-value buybacks as employee ownership rises. The employee-ownership transfer changes the timing and label of the cash, not the existence of the cash.
Author-modeled output Per-acquisition perpetual-hold model output at default settings. Sensitivity: at 4× entry IRR ≈ 17%; at 6× entry IRR ≈ 12%. Rounded value-attribution pieces sum to ~$15.8M versus the displayed $15.9M total because the underlying model uses unrounded annual cash flows. Source: model derived from SEC S-4/A — "Our Platform" and Live Oak Forecasts §1, §4.
The output above is not a company forecast. It uses Teamshares' stated acquisition framework, assumes 80% EBITDA-to-FCF conversion, holds the fair-value multiple flat through the ownership-transfer period, and treats the employee-ownership grants as the economic equivalent of sponsor dilution. Change any of those inputs and the answer moves. The model is useful because it isolates the trade-off: the return is not killed by giving employees ownership; it is killed if the debt is too expensive, growth is too slow, or corporate overhead absorbs the subsidiary cash before it can recycle.
Assumptions to stress-test
100% subsidiary survival assumed. The model contains no write-off rate. Across 92+ small businesses held over 20 years, some will fail. The S-4/A does not disclose subsidiary-level attrition or cumulative write-offs. In a real portfolio, 5–15% cumulative loss over a two-decade horizon is within industry norms. Each loss zeros the equity check for that vintage and the corresponding 20-year buyback stream.
Constant 5% organic growth. Real SMBs have lumpy, sometimes negative years. A recession hitting years 2–4 (while senior debt is still amortizing) compresses the early distributions that drive most of the IRR's present value. The tornado's 0% growth downside captures this directionally, but a correlated downturn across multiple subsidiaries simultaneously is a portfolio-level risk the single-acquisition model cannot show.
The 2025 pace deceleration. Teamshares closed 9 acquisitions in 2025 against a stated goal of 40 per year by 2027 — a 4.4× ramp required in two years. The filings attribute this to capital constraints: the i80 maturity window restricted new deployment. Whether the pace recovers post-refinancing is the primary execution question in the 2026–2027 forecast period.
Firm-level IRR — what actually moves it
The deal-level model assumes the holdco is a passive funder with no ongoing cost. That is the wrong model for Teamshares. The holdco is a corporate platform with a $42M-a-year overhead that has to be paid out of the same distributions that fund the deal-level return.
The 12% firm-level baseline below is the 14.8% deal-level IRR net of corporate overhead at today's scale. With ~$42M of annual overhead (Forecasts §3) spread across the current ~92 subsidiaries, that's roughly $456K per company per year — enough to absorb 2–3 points of IRR at the per-sub level. As the platform scales toward 250+ subsidiaries the per-sub drag falls toward $170K and the firm-level IRR converges back up toward the deal-level IRR. That convergence is what the first bar of the tornado below — number of subsidiaries — is showing on the high side. Numbers are illustrative; the goal is the order of magnitude, not three-decimal precision.
The debt ladder is the financing constraint
The financing layer matters because it changes when cash starts flowing back to the holdco. The chart below stacks the disclosed rates side by side: i80 is the legacy structured-credit line maturing in December 2026; the rest of the capital structure is what Teamshares is trying to move toward as the platform scales and the repayment record gets easier to underwrite.
In the perpetual model, financing cost matters because there is no exit multiple to bail anyone out. Every dollar of interest paid in years 1–7 is a dollar that doesn't compound at the company's economic-return rate for the remaining ~13 years of the buyback arc. At 15% senior cost, the company is still paying down debt deep into the buyback period, distributions to the holdco get pushed out, and the buyback formula gets paid against a more leveraged company. At 8% senior cost, debt is gone before year five, the next 15 years of distributions and buyback proceeds compound from a cleaner balance sheet.
Firm-level math: the corporate overhead drag
The deal math looks fine. The firm math is where the platform constraint shows up. Teamshares' parent operates with "over 90 employees" — a corporate platform that cost roughly $39–44 million in 2025 and is forecast to cost $40–45 million in 2026 and $48–52 million in 2027. The Live Oak forecast file calls this a "~25% increase in corporate overhead during the Forecast Period, primarily associated with estimated increased costs associated with becoming a public company."
There's a second-order question about whether ninety is even the right headcount. The cleanest benchmark is not a literal twelve-person Teamshares clone — Teamshares is carrying software, accounting, recruiting, onboarding, public-company preparation, and a multi-industry acquisition machine. The cleaner question is what a focused entrant would need to underwrite one vertical or one geography. Against that narrower mandate, even $200K of overhead per portfolio company can be high, and the right denominator is acquisition opportunities evaluated per year, not just the current portfolio. Teamshares evaluates ~1,500 deals per year with a 90-person platform; a focused platform evaluating a smaller but denser funnel has a different cost structure with comparable per-decision intensity.
Focus on the $42M number. It's fixed today. What scales is the number of subsidiaries paying it. The chart below shows the per-subsidiary overhead burden against the number of operating companies, holding overhead at the 2026 forecast level.
Two read-throughs from this chart matter for the thesis. First, scale at the holdco is what makes the corporate overhead "free" — and Teamshares is not yet at that scale. Second, a smaller, focused clone may outperform Teamshares on risk-adjusted IRR before reaching 92 acquisitions. That is not because the clone is smarter. It is because the clone can avoid building a national, multi-industry, public-company-ready platform before it has enough subsidiaries to pay for one. The big scale story works for the operator that gets there. It is not a constraint on the strategy.
The dilution mechanics, in detail — the 20-year ownership transfer
This is the part of the model that turns the deal-level math into a Teamshares-specific question, and it's the part that the SEC filings describe at the most general level. At each acquisition, Teamshares creates "an employee pool of restricted common stock initially representing 10% of the operating subsidiary's stock on a fully-diluted basis," with four-year vesting. Beyond that initial pool, "employees are able to earn more ownership as the business succeeds and generates cash to distribute" — i.e., dilution above 10% is funded out of subsidiary cash flow (S-4/A, "Teamshares' Employee Shareholder Program").
The mechanism is not a one-time grant followed by a vesting schedule. The S-4/A does not call it a forced repurchase; that phrase is the economic shorthand I use for the modeled sponsor-perspective cash flow. In that model, each year the operating subsidiary uses a portion of its own free cash flow to move value from the holdco-owned equity stake into the employee pool at fair value. By the end of the buyback period the holdco's economic interest has fallen from ~90% (after the initial 10% pool is granted) to ~10%. The subsidiary becomes ~90% employee-owned, almost the inverse of where it started.
The structure works because it solves three jobs at once. It gives employees an immediate ownership signal, which makes the promise visible on acquisition day instead of turning it into a distant bonus plan. It gives retiring sellers a buyer story that is emotionally different from a financial sponsor flipping the company in five years. And it lets Teamshares keep operating control while the ownership percentage migrates over time, which matters if the holdco is underwriting debt, hiring presidents, and running a repeatable acquisition system across dozens of subsidiaries.
That has three consequences a sponsor has to live with:
- Cash flow has four claims on it. For most of the subsidiary's life, cash is split among senior interest, seller interest, sponsor distribution, and the buyback line. In the typical acquisition, the buyback line becomes the largest of the four from years 8 through 20.
- Growth is monetized, but slowly. Because the buyback is paid at fair value, operating improvement is not given away. The sponsor is paid partly through declining year-by-year distributions and partly as the holdco's stake is sold down at the prevailing valuation. What is lost is timing: instead of crystallizing growth at a year-five exit, the sponsor receives the value in installments over two decades.
- The residual matters, but it is small. After year 20, the sponsor's remaining 10% stake is the only long-tail stream the holdco keeps in perpetuity. It is real, but it is not a conventional exit option.
The dollar magnitude of the buyback over the full arc is large. At the default model inputs, a $5M-purchase-price subsidiary cycles roughly $5–7M of buyback proceeds back to the holdco over 20 years (the exact number depends on growth and amort schedule), on top of distributions. That's the total cash that flows back. But it's also the only flow — the sponsor is not preserving an exit-multiple call option on the way out. The financial structure is that of a perpetual annuity that pays the sponsor its declining ownership share of the asset's free cash flow forever, plus a 20-year repurchase program that compresses ownership toward 10%.
The buyback is not dilution in the pejorative sense. The holdco is paid fair value for every point it gives up. The cost is time — and time has a price when capital is scarce.
The filing describes employee equity as restricted common stock classified as stock-based compensation. No secondary market or periodic buyback window is disclosed. Employees hold illiquid paper until a separation event (resignation, retirement, termination) or a company-level liquidity event — and vesting requires four years of continuous service. A clone structuring a similar program must decide upfront whether the equity comes with periodic liquidity (annual cash-out at appraised value) or deferred liquidity (value only on exit). The choice changes how employees perceive the ownership promise.
A note on what governs the buyback price
The S-4/A does not use the phrase "forced repurchase," does not specify a 20-year schedule, and does not invoke Rule 701. The proxy describes the mechanism more loosely: "Employees are able to earn more ownership as the business succeeds and generates cash to distribute… Our employee shareholder program for employees of operating subsidiaries is reflected in our financial statements as stock-based compensation expense and classified as equity under US GAAP." The 20-year arc and the 90%-to-10% compression in this teardown are reconstructed from a TechCrunch interview with Michael Brown (August 2023)4 plus the broad commitments in the proxy; the precise schedule is not in any filed document.
That detail matters because it determines which legal definition prices each year's value transfer. Two terms that get used interchangeably in this kind of structure are not, in fact, interchangeable.
| Term | Where used | Definition | Source |
|---|---|---|---|
| Fair Market Value (FMV) | IRC §409A · Rule 701 · §83(b) | Independent appraisal of common stock at grant date — required for setting strike on Rule 701 grants and avoiding §409A penalties on deferred compensation. Typically a third-party 409A valuation, refreshed at least every twelve months. | IRS · SEC |
| Fair Value | ASC 820 · ASC 718 · GAAP | Exit-price valuation — the price a willing buyer would pay in an arm's-length transaction at the measurement date. Used for stock-based compensation expense, repurchase obligations, and contingent consideration on the balance sheet. | FASB |
FMV (tax/securities) versus Fair Value (accounting). Both look like "what the stock is worth," but they are governed by different rule sets, refreshed on different cadences, and may yield different numbers for the same security on the same day.
Because Teamshares' employee shareholder program is classified as stock-based compensation expense under US GAAP (S-4/A, "Teamshares' Employee Shareholder Program"), ASC 820 Fair Value is what governs each year's measurement of the value transferred to employees — not Rule 701 / §409A FMV. Each year's grant is recognized as compensation expense at grant-date Fair Value and matched by an offsetting equity-classified credit. Mechanically, there is no cash repurchase from holdco to subsidiary in the GAAP framing — it is a non-cash transfer of equity to employees, expensed at Fair Value. The "buyback" framing in this teardown is the economically equivalent way of looking at the same flow from the sponsor's perspective: every year's SBC charge is a year's worth of sponsor dilution.
For an operator structuring a clone, the practical consequence is that the choice between (a) FMV-priced annual cash repurchases and (b) ASC 820 Fair Value SBC grants is a tax-and-accounting choice with material cash-flow implications. Path (a) puts cash into employee hands every year (taxable as ordinary income or capital gains depending on the holding) and shows up as a use of subsidiary cash; path (b) defers the cash event until the employee separates or is bought out and shows up as a non-cash compensation charge against earnings. Teamshares has chosen path (b). A clone underwriting this strategy needs to make the choice deliberately — it changes both the after-tax math for employees and the GAAP earnings profile of the holdco.
Which driver matters most: financing cost, growth, or buyback shape?
The perpetual model rebalances the answer compared to a five-year LBO. There are still three real drivers; multiple movement is no longer one of them.
| Driver | Effect on lifetime MOIC | Where it bites |
|---|---|---|
| Financing cost (vs. entry price) | Material but secondary. A 5-point cut in senior cost adds less than half a turn of MOIC over the full arc — interest in years 1–7 substitutes for distributions in years 8–20, but the absolute substitution is small relative to the compounded growth effect. | Determines when the company stops paying lenders and starts paying the sponsor. A slow vintage is a permanently smaller vintage. |
| Post-acquisition growth | Largest single driver. Doubling growth from 5% to 10% adds three to four turns of MOIC. Growth gets multiplied across all 20 years of distributions and into the buyback formula via fair-value pricing — every dollar of FCF and every fair-value buyback cheque compounds at the growth rate. | Compounds the size of every cash flow the sponsor receives. Growth dominates the perpetual frame because there is no exit — total cash size matters more than timing when the buyback compresses the sponsor's stake at fair value year over year, and every fair-value cheque is priced off the then-current EBITDA. |
| Buyback shape (terminal % and period) | Material. Setting sponsor terminal ownership at 30% instead of 10%, or extending the buyback period from 20 years to 30, materially raises lifetime MOIC by widening the slow-tail and making the residual stake larger. | Is the asset class. The shape of this curve is where Teamshares' brand promise to sellers actually shows up in the equity math. |
| Multiple movement | Zero. There's no exit. The model holds entry multiple = "fair value" multiple throughout, since the buyback prices each year's transferred shares. | Disappears as a lever. This is a feature, not a bug — it's the cleanest part of the underwriting. |
| Corporate overhead | Doesn't appear in deal-level MOIC. At firm level it's the difference between −$9M Pro Forma Adj EBITDA in 2024 and the path to $100M+ in 2027. | Hits the holdco, not the subsidiary. The scale concern you started with. |
If you had to pick one to argue with, the cleanest answer in the perpetual frame is growth edges out financing cost, and the buyback shape is the third leg of a tripod. Growth decides how big every cash flow becomes — and the buyback re-prices each year at the new fair value, so growth compounds twice. Debt pricing decides how soon cash flows start reaching the sponsor. The buyback shape decides how those cash flows are timed across the sponsor's twenty-year arc. Two of the three drivers are levers Teamshares can pull as the platform scales: financing through repayment history, growth through the operating playbook. The third is fixed by the brand promise.
Why the financial mechanics are broadly copyable
None of the inputs to the deal-level model above require Teamshares to execute. Every line is available to a moderately well-capitalized operator with discipline.
| Lever | Why it's a commodity |
|---|---|
| 4–6x entry multiple | Universally available in the $0.5M–$5.0M EBITDA band. Auctions don't reach down to this size; pricing comes from negotiation, not competitive bidding. |
| 3x senior + 1x seller note | SBA lenders, regional banks, and lower-mid private credit all underwrite this stack. Seller financing is negotiated, not invented. |
| ~80% EBITDA-to-FCF conversion | A property of the asset class, not the operator. SMB services and distribution businesses are capex-light by nature. |
| Monthly cash sweep covenant | Standard credit-facility language. Not proprietary. |
| 10% employee equity pool | Structurally available, but not casual. The cap table is easy; the tax, securities, valuation, employee-communications, and repurchase-policy work is where the friction lives. |
| Indefinite hold, FCF-funded buyback to 90% employee-owned | Mechanically available and funded from subsidiary FCF. The hard parts are governance, valuation, liquidity, and patience — especially the 20-year horizon most sponsors won't tolerate. |
There's nothing on this list that takes a Teamshares to execute. Permanent-capital vehicles, family offices, and self-funded operators can all underwrite versions of this trade. The point is narrower than "easy": the financial architecture is available. The operating credibility required to make sellers, employees, presidents, lenders, and auditors accept it is the scarce part.
How much room is there for clones?
The supply side is structurally enormous. Even Teamshares' aspirational long-term goals capture a tiny fraction of what's transitioning. The funnel below is what the company actually sees per year, from its own filings.
The binding constraint isn't deal availability. It's operator pipeline, capital efficiency, and the discipline not to chase paper at higher multiples. I would not underwrite a dozen fully generalist Teamshares copies all chasing the same broker conversations. I would underwrite many narrower versions: one vertical, one geography, or one employee archetype, each with enough room to avoid forcing entry multiples out of the 4–6x band.
Inside the funnel, the steep drop-off — 1,500 NDAs to 9 closes — reflects seller-behavior patterns more than deal economics. Many owners kick tires without serious intent. Many want a valuation conversation but aren't actually ready to sell. The retiring-owner cohort is structurally late: most lack the incentive to begin a transition until very late in their career, when health, family, or a forcing event makes the decision unavoidable. The funnel narrows because most sellers aren't yet sellers — and that timing problem doesn't compress for any new entrant.
What's actually hard to copy
The financial model is a commodity. The operating layer isn't. Below is the moat in rough order of how long it would take a well-capitalized clone to match it.
| Dimension | What Teamshares has | Replication time |
|---|---|---|
| Sourcing funnel | ~75K listings ingested per year via internal software; broker trust at the lower-middle mark; 1,500 acquisitions evaluated per year1 | 3–5 years to build software + broker relationships |
| President pipeline | 86% placement-and-retention success rate since the 2023 hiring overhaul (denominator not disclosed — the stat covers ~2.5 years of placements); in-house onboarding program; "Group President" supervisory layer1 | 2–4 years; the hiring screen is the hard part |
| Cost-of-capital track record | i80 facility (2021) → public-company refinance (2026E). Each step requires paid-back vintages. | 4+ years of repayment history |
| Brand with sellers | "Sell to your employees, not to PE." Material in the broker community for owners with 30+ year tenure. Soft, real. | Hard to compress. Word of mouth in a fragmented industry. |
| Scale economies on overhead | ~$42M corporate cost. Needs ~210 subsidiaries before the per-company drag drops below $200K.1 | Capital + time, not skill. But ~5 years from today's level at 40 deals/yr. |
| Operating data flywheel | Across 90+ subsidiaries, a structured benchmarking dataset on industries the rest of the lower-mid market sees only one company at a time | 3–5 years; valuable mostly to a multi-vertical generalist |
Source: SEC S-4/A — "Our Growth Opportunity," "Our Platform," "Our Operating Subsidiaries," and Teamshares' president-placement disclosures.
None of these are unbeatable individually. The cumulative time-to-replicate is the gap. A clone that picks a single vertical or a single geography can sidestep most of these and win in its slice without going head-to-head; it does not need to beat Teamshares globally. But the all-of-it integrated proposition Teamshares is offering retiring owners — "sell to a buyer who already owns 90 other companies, isn't going to flip you in five years, and is leaving 10–80% of the stock with your employees" — is genuinely hard to put together.
Appendix: current financing footnote
KPMG's audit opinion3 on Teamshares' 2024 and 2025 financials states: "since both facilities will mature within a period less than twelve months after the issuance date of the accompanying consolidated financial statements, management has concluded there is substantial doubt regarding the Company's ability to continue as a going concern within the 12-month period following the 2025 Audit Report Date. The Company's existing liquidity and forecasted cash flows during such period are not sufficient to repay the Company's existing indebtedness obligations."
The filing language is specific. As of December 31, 2025 Teamshares had $40.3M of cash and $13.9M of restricted cash against $275M of debt1. The i80 facility ($153.4M outstanding, weighted-avg 15.2% in 2025) matures December 5, 2026. The HBC facility ($30.3M, originated December 24, 2025 with a $5.3M debt discount) matures the earliest of December 24, 2026, the SPAC closing date, or the merger-agreement termination. Roughly $206M of total debt comes due within twelve months of the audit report. Those maturities make refinancing a near-term gating item, not the core operating thesis.
If the SPAC does not close and no alternative refinancing lands: the company faces $206M of maturities against $40M of unrestricted cash. The downside path is a forced asset-level refinancing at distressed terms, a portfolio sale of individual subsidiaries, or (in the extreme) lender-driven restructuring. The subsidiaries themselves are cash-generative — the crisis sits at the holdco financing level, not the operating level — which is what makes a workout possible without destroying the underlying businesses.
| Debt item | Amount / rate | Why it matters |
|---|---|---|
| Cash | $40.3M | Unrestricted cash at Dec. 31, 2025 |
| Restricted cash | $13.9M | Not freely available for general corporate use |
| i80 facility | $153.4M · 15.2% | Matures Dec. 5, 2026 |
| HBC facility | $30.3M | Matures Dec. 24, 2026 or earlier triggering event |
| Debt due within 12 months | ~$206M | Core reason for the going-concern language |
Appendix: SPAC transaction context
Current transaction wrapper, as of May 17, 2026: Live Oak's materials imply roughly $742M of Teamshares enterprise value and about $910M of pro forma market cap at $10.00 per share, with the outside date extended to July 15, 2026. The May 13, 2026 second amendment mostly addresses preferred-stock liquidation-preference election mechanics and states that the changes do not materially alter the transaction's overall economics or structure. Useful context, but not the evergreen part of the article. The core question here is still whether the operating system can make the ownership-transfer model work at scale.
What would make this wrong?Click to expand the bear case
The strongest version of the bear case is not that Teamshares bought bad businesses. The stronger attack is that the model is trying to make five fragile systems work at the same time: seller trust, president hiring, cheap enough debt, employee-ownership governance, and low enough corporate overhead. Break any two of those and the attractive deal-level math stops mattering.
| Attack | Why it matters | What would change my mind |
|---|---|---|
| FCF conversion is overstated | The whole model leans on 75–85% EBITDA-to-FCF conversion. If maintenance capex, working capital, public-company controls, or president compensation absorb more cash than expected, the buyback and debt-paydown schedule slips. | Cohort data showing cash conversion by acquisition vintage after owner transition, excluding add-back noise. |
| Cheap debt is not available at scale | At 15% senior cost, the perpetual-hold math gets thin quickly. Refinancing is not cosmetic; it is the bridge from interesting deal economics to acceptable firm-level returns. | A successful i80/HBC refinance into durable single-company or portfolio-level facilities at a materially lower all-in rate. |
| President hiring is the real bottleneck | Deal supply can be enormous and still useless if the operator bench cannot absorb 30–40 new companies per year without quality degradation. | Continued retention and operating performance as acquisition pace rises, not just a disclosed placement success rate. |
| Employee ownership creates governance friction | The structure depends on employees believing the equity is real while the holdco still controls capital allocation, valuation policy, and repurchase timing. A credibility break turns the brand promise into a liability. | Clear subsidiary-level disclosure on valuation cadence, employee liquidity, repurchase rights, and dispute mechanics. |
| Corporate overhead never scales down | The platform is expensive before it is efficient. If public-company cost and cross-industry complexity rise with acquisitions, scale may not amortize the way the model assumes. | Evidence that corporate cost per subsidiary falls as forecast while acquisition quality and subsidiary cash conversion hold. |
The next few filings should make the debate much less abstract. The right way to read Teamshares from here is not as a story stock, but as a sequence of observable tests.
| Evidence to watch | What excellence would look like | What would worry me |
|---|---|---|
| Debt refinance | i80/HBC maturities pushed out or refinanced into lower-cost subsidiary or portfolio-level debt, with less cash-flow leakage in years 1–7. | A maturity extension that keeps the all-in rate high, or new bridge capital that solves liquidity while making every future acquisition harder to finance. |
| Acquisition pace | A credible climb from single-digit annual closes toward the 2027 ambition without loosening the 4–6× entry discipline or lowering quality. | Higher close volume purchased by relaxing EBITDA quality, increasing multiples, or accepting sellers who are not culturally aligned with employee ownership. |
| Corporate cost per subsidiary | Corporate expense grows slower than subsidiary count, so the per-company drag visibly falls toward the $200K threshold. | Public-company cost, finance staff, compliance, and cross-industry complexity rising roughly one-for-one with the portfolio. |
| President cohort quality | Retention and operating performance remain strong as the company places more presidents per year, not just in the post-2023 reset cohort. | Stable placement statistics masking weaker subsidiary growth, more holdco intervention, or rising turnover after the first full year. |
| Employee-ownership credibility | Clear disclosure on valuation cadence, liquidity rights, termination treatment, and how employees experience value creation in cash terms. | The equity promise becoming accounting expense without employee-understandable liquidity, governance, or trust. |
My forward evidence board. These are the observable tests that would either strengthen or weaken the thesis over the next reporting cycle.
If you're an operator considering this space
The playbook is not one grand thesis. It is a set of operating choices that have to be made before the first close: what you will buy, who will run it, how patient the capital is, and how credible the employee-ownership promise will be.
Deal discipline
- Underwrite to EBITDAC, not EBITDA. In this size band, owner's compensation and personal expenses run through the company are routine. Standard EBITDA understates earnings. A 5x EBITDAC is a different price than a 5x EBITDA — get the add-back framework right or mis-price the deal.
- Walk away above 6x EBITDA. Discipline is the only durable input on the deal-math side.
- Decide your buyback shape before you decide your underwriting. A 10% pool with no further dilution looks like a normal LBO. A 20-year ownership transfer to 90% employee ownership is a different asset class. The pricing of every input — entry multiple, financing cost, growth case — is downstream of which shape you pick. Don't underwrite one and structure the other.
People and sourcing
- Pick a vertical or a geography — not both simultaneously. Don't try to outscale Teamshares on generalism. Their data flywheel and broker-trust gain matter most across industries. Across one industry, a focused operator wins. Industry expertise is what makes the sourcing reputation credible — and a credible sourcing funnel takes 3+ years to build, with the president pipeline another 2+ years on top.
- Build the broker funnel before the software. Trust compounds slower than code. Teamshares' funnel is broker plus software; the broker layer is the part that took five years.
- Specify the post-acquisition operational playbook before you scale. Pricing software, dispatch optimization, marketing — these are the levers that deliver the post-acquisition EBITDA growth assumed in the model. Blue-collar service businesses face growth constraints that an RIA-style rollup does not. Value creation has to come from operational specifics, not category tailwinds.
Capital architecture
- Keep corporate overhead under $200K per subsidiary — and ideally lower. The platform-headcount tax is the real killer of firm-level IRR. Do not benchmark yourself against Teamshares' 90-person generalist platform if you are building a focused entrant; benchmark against the smallest corporate layer that can source, diligence, finance, recruit for, and govern the actual number of subsidiaries you plan to own. Measure overhead against acquisition opportunities evaluated, not just current portfolio.
- Plan for expensive debt initially, then scale it down. An i80-style structured-credit vintage is sometimes the only debt available before the track record exists; the discipline is keeping it small and refinancing into cheaper paper as paid-back vintages accumulate. Better to start expensive-and-small than expensive-and-large.
- Raise patient equity capital before you start. The model needs at least a 3–4 year horizon to prove out — meaning the equity has to be willing to compound through several deal vintages without distributions. A private billionaire-type investor with no fund timeline is the ideal source; raising patient capital without a track record is the hardest single problem in this strategy.
Governance and incentives
- Pick your accounting path: cash repurchase at FMV, or SBC grants at ASC 820 Fair Value. See the FMV vs. Fair Value section above. Path (a) — annual cash repurchase from the holdco at independently appraised FMV — puts cash into employee hands every year and shows up as a use of subsidiary cash. Path (b) — Teamshares' chosen path — issues additional equity at GAAP Fair Value and runs through stock-based compensation expense, with no cash event until separation. The choice is upstream of every other model input and changes both the after-tax math for employees and the GAAP earnings profile of the holdco. Make it deliberately, before the first deal closes.
- Treat consolidation purchasing as an opt-in benefit, not a tax. The platform's natural advantage at scale is volume discounts on software and services for portfolio companies. Make participation optional and align incentives — the goal is shared cost reduction, not extracting fees from every transaction.
- Consider a synthetic-equity structure as an alternative. KPI bonuses plus a growth percentage plus a profitability split can deliver most of the alignment benefit without the legal complexity of actual equity ownership. The trade-off: employees will be skeptical until you've paid through the structure for a full cycle. Real equity is more credible at first handshake; synthetic equity is cheaper to operate.
Takeaway
The financial mechanics are replicable and available to anyone. Every input in the deal-level model is accessible to any operator with capital and underwriting discipline. Debt pricing and post-acquisition growth are the two largest drivers in a perpetual-hold frame, with debt pricing edging out growth — counterintuitive but real, because cash-flow timing matters more than total cash over a 20-year arc. Exit multiple disappears because there is no exit. The buyback is not a back-end haircut; the holdco is paid fair value for every point surrendered. What is compressed is timing.
The operating model is the moat — and it took a decade to build. The sourcing funnel, the placed-president retention rate, and the brand with retiring owners do not appear on any balance sheet. They are the only components that are structurally hard to replicate, and they are exactly what makes the 20-year employee-ownership pitch credible to a 65-year-old owner who spent 35 years building a business.
Teamshares did not invent better deals. It built a system that can execute them at scale. The white space is deep enough that a focused clone in a single vertical can coexist beside it for a decade. If you're considering this strategy, your effort belongs on the operating layer.
The deal math is already a solved problem. The operating model is not.
Sources and references
1 SEC filings. Live Oak / Teamshares April 2026 preliminary S-4; April 30, 2026 S-4/A (primary filing — contains "Our Platform," "Our Operating Subsidiaries," "Teamshares' Employee Shareholder Program," Risk Factors, MD&A, Forecasts §§1–4, and the Live Oak Reasons for the Business Combination); May 1, 2026 outside-date 8-K/425; May 13, 2026 merger-amendment 8-K/425 (preferred-stock liquidation-preference election mechanics); May 2026 Form 10-Q; and additional transaction 8-Ks and 425s filed during the de-SPAC process. Specific sections cited throughout: "Our Platform" (deal structure, acquisition targets, EBITDA-to-FCF conversion), "Our Growth Opportunity" (TAM, funnel), Risk Factors (i80 facility terms, going-concern language), Forecasts §3 ("Corporate Expenses"), Forecasts §4d (cost-of-debt assumptions). ↩
2 Investor Day. Live Oak Acquisition Corp. V / Teamshares Inc. Investor Day presentation, March 31, 2026. CFO Brian Gaebe's remarks on deal-level RoE methodology (year-one levered FCF / equity check at target leverage), historical 13.5% blended cost of debt yielding ~22% platform RoE, and the distinction between single-year cash yield and lifetime IRR. Referenced in the Deal-Level RoE callout and the deal-economics table. ↩
3 KPMG going-concern opinion. KPMG LLP, Independent Auditor's Report on Teamshares Inc. consolidated financial statements for the years ended December 31, 2024 and 2025 (included in the S-4/A). Key language: "substantial doubt regarding the Company's ability to continue as a going concern within the 12-month period following the 2025 Audit Report Date." Triggered by i80 ($153.4M, maturing Dec. 5, 2026) and HBC ($30.3M) facilities both maturing within twelve months. ↩
4 TechCrunch interview. Connie Loizos, "This venture-backed startup has quietly bought more than 80 mom-and-pop shops," TechCrunch, August 24, 2023. Interview with co-founder Michael Brown. Primary source for the 20-year employee-ownership arc and the ~90%-to-10% holdco ownership compression — details not disclosed in any SEC filing.
5 Regulatory and accounting standards referenced. IRC §409A (deferred compensation); SEC Rule 701 (compensatory equity grants by non-reporting issuers); IRC §83(b) (election to recognize income at grant); FASB ASC 820 (Fair Value Measurement); FASB ASC 718 (Compensation — Stock Compensation). The FMV-vs.-Fair-Value distinction in the buyback-price section draws on these standards.
Model outputs, chart ranges, and sensitivity analyses are author-derived from the sources above unless otherwise noted. Numbers are illustrative where stated. Not investment advice.